3.3.8 Compare/Combine
In this section, you can leverage the powerful "Compare/Combine" functionality to analyze and compare multiple sources or selected sources. This feature enables you to gain valuable insights by examining various aspects across different sources.
Functionalities and Charts
Select Sources and Source Grouping
Select Sources: Choose the sources you want to compare or combine for in-depth analysis.
Source Grouping: Group selected sources to streamline your analysis based on specific criteria or preferences.
Compare or Combine Option
Decide whether you want to "Compare" or "Combine" the selected sources for your analysis. The choice you make will determine the charts available for examination.
When "Compare" Selected
POSITIVITY RANK
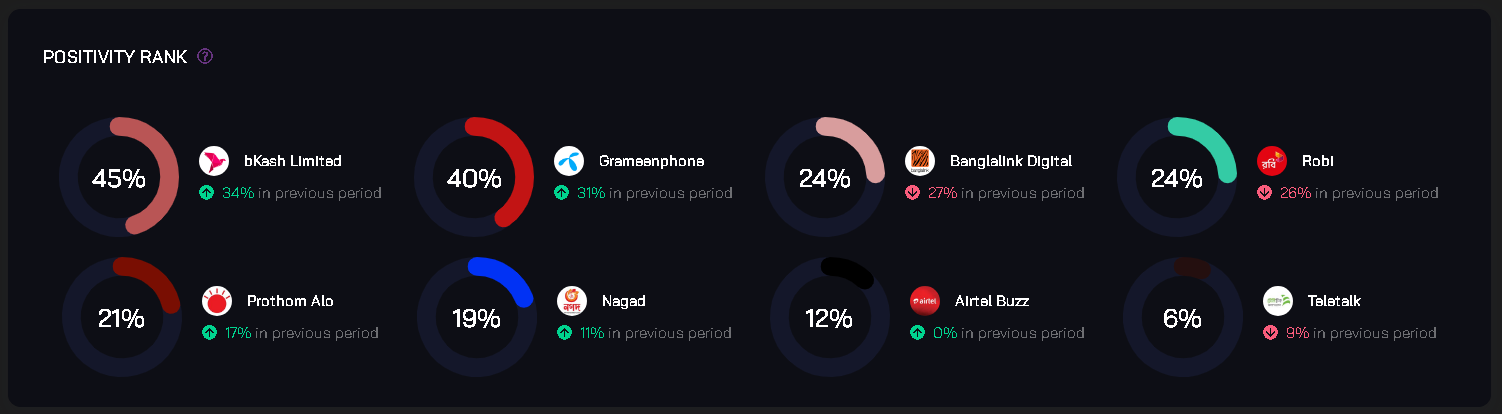 Rank sources based on overall positivity in their content.
ADMIN POSTS
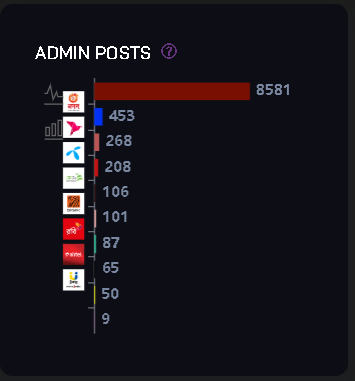 Analyze administrative posts from the selected sources.
AUDIENCE POSTS
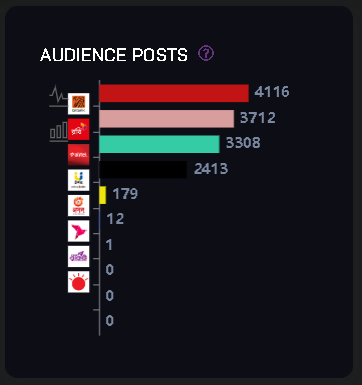 Examine audience-generated posts across the selected sources.
AUDIENCE COMMENTS
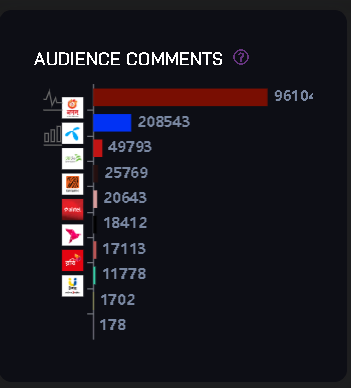 Dive into audience comments to understand user engagement.
REACTIONS
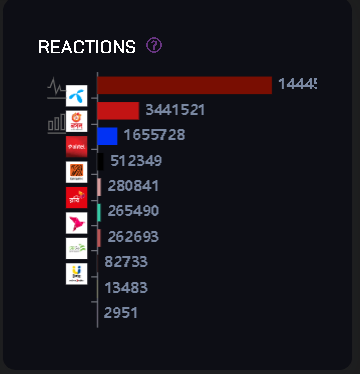 Track reactions (likes, shares, comments) for the selected sources.
ADMIN POSTS TIMELINE
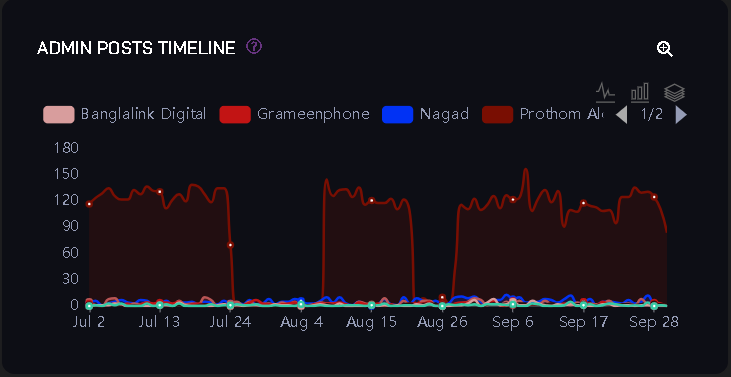 Visualize the timeline of administrative posts.
AUDIENCE POSTS AND COMMENTS TIMELINE
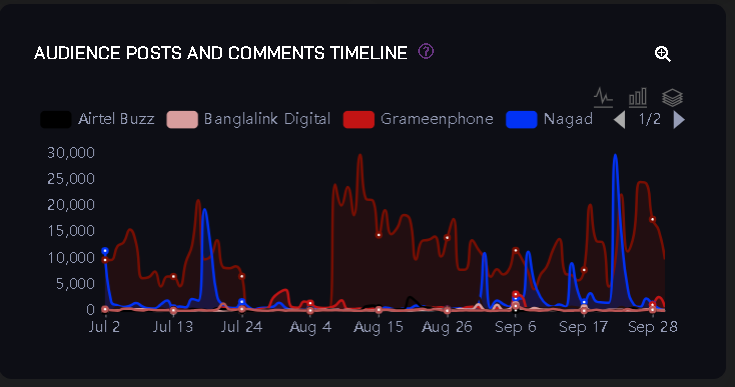 Explore the timeline of audience posts and comments.
SOURCE WISE POST TYPE DISTRIBUTION
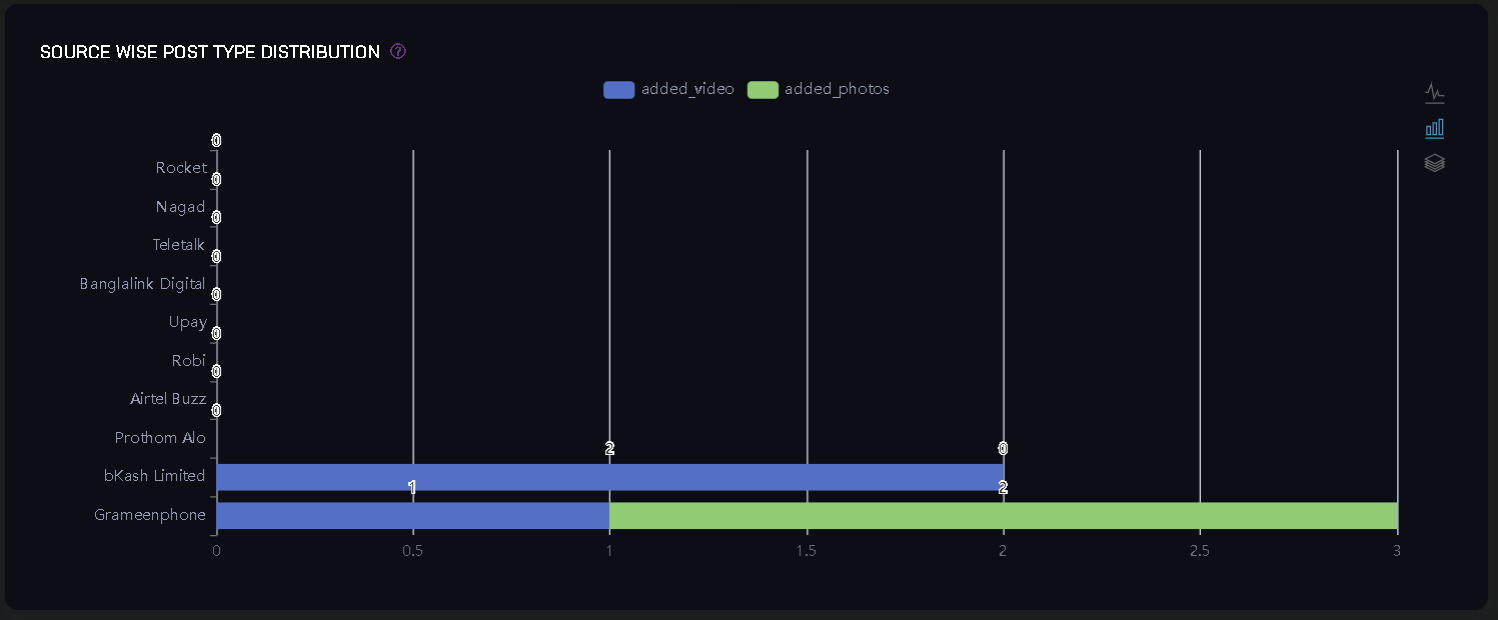 Analyze post type distribution across selected sources.
MOST ENGAGING POST TYPE
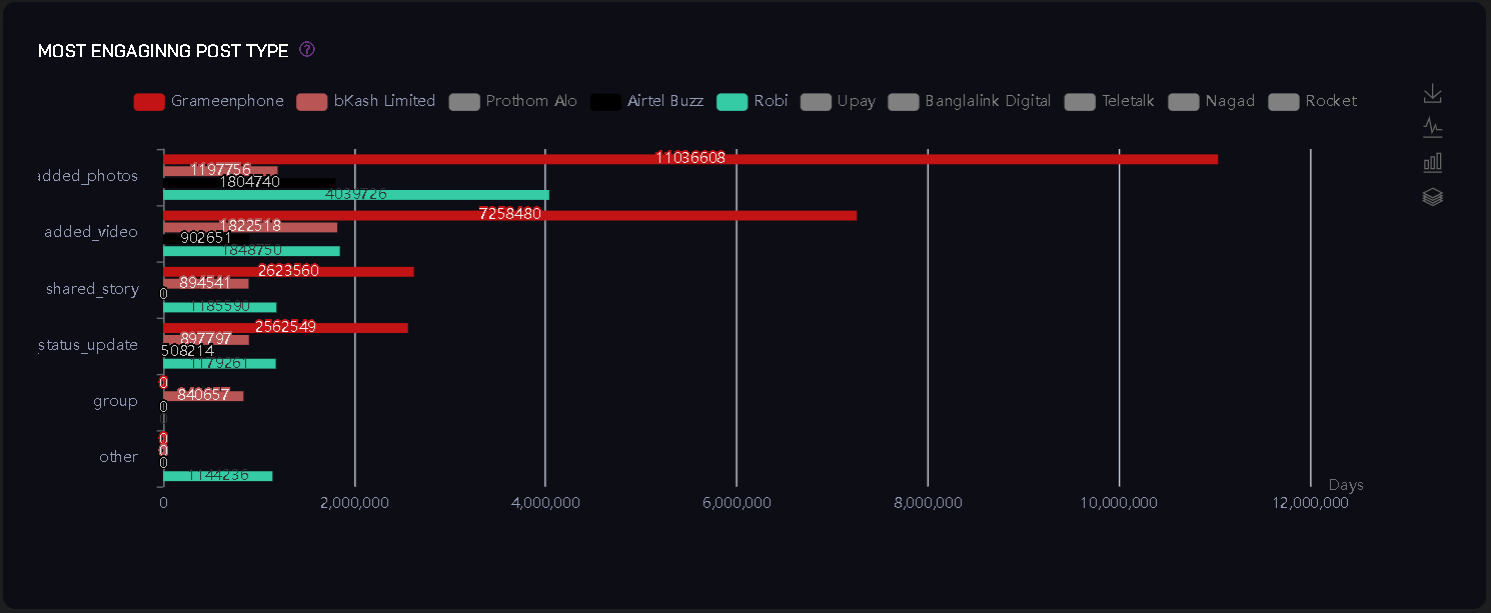 Identify the most engaging post types across sources.
SOURCE WISE ENGAGEMENT TIMELINE
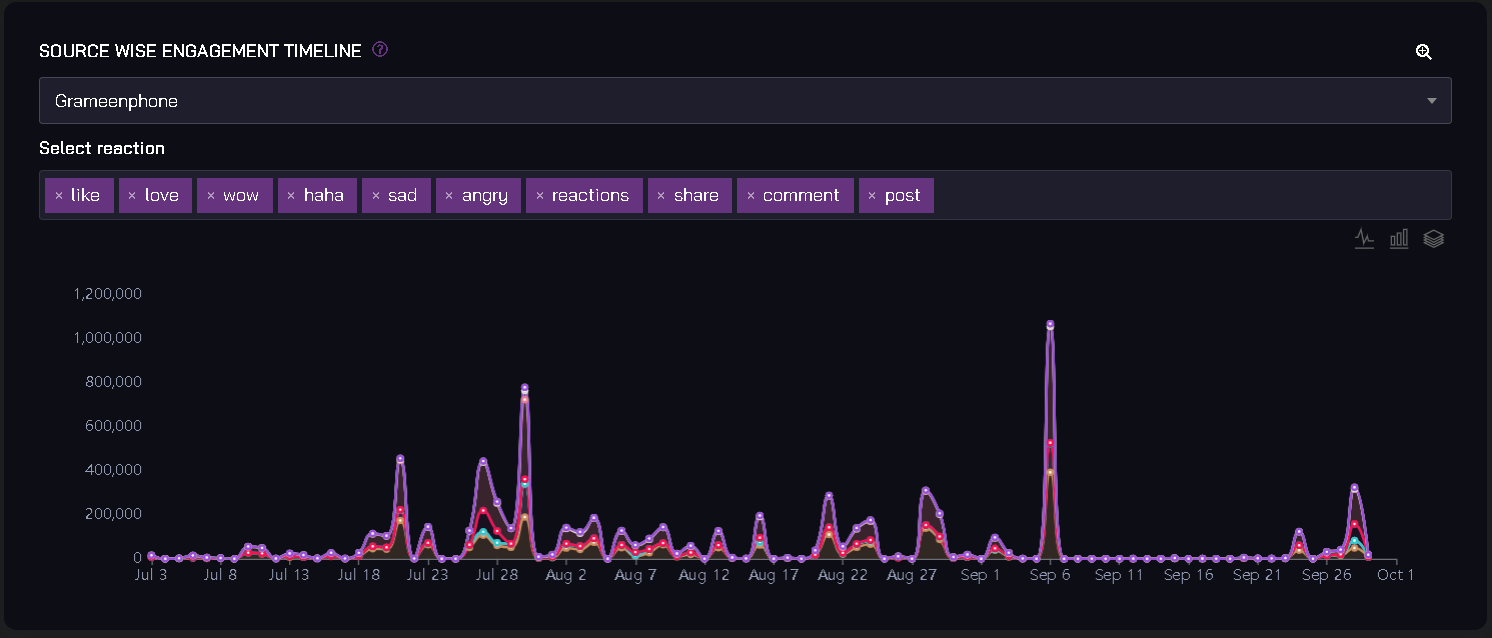 Visualize source-specific engagement over time.
SOURCE WISE SENTIMENT DISTRIBUTION
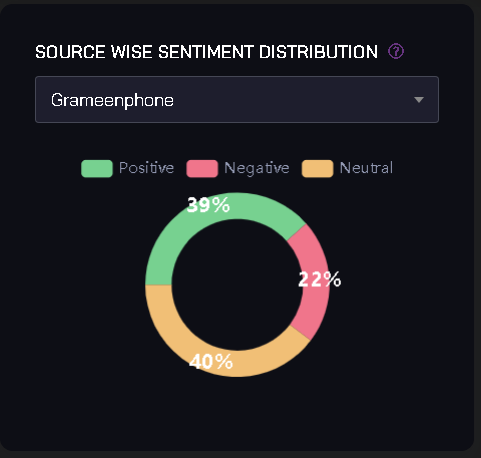 Explore sentiment distribution for each source.
SOURCE WISE SENTIMENT TIMELINE
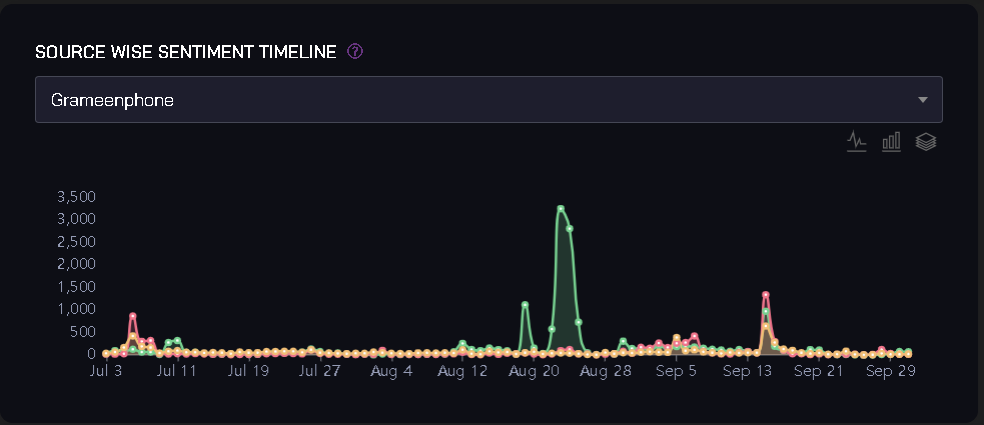 Track the sentiment timeline for each source.
SOURCE WISE TOPIC CLOUD
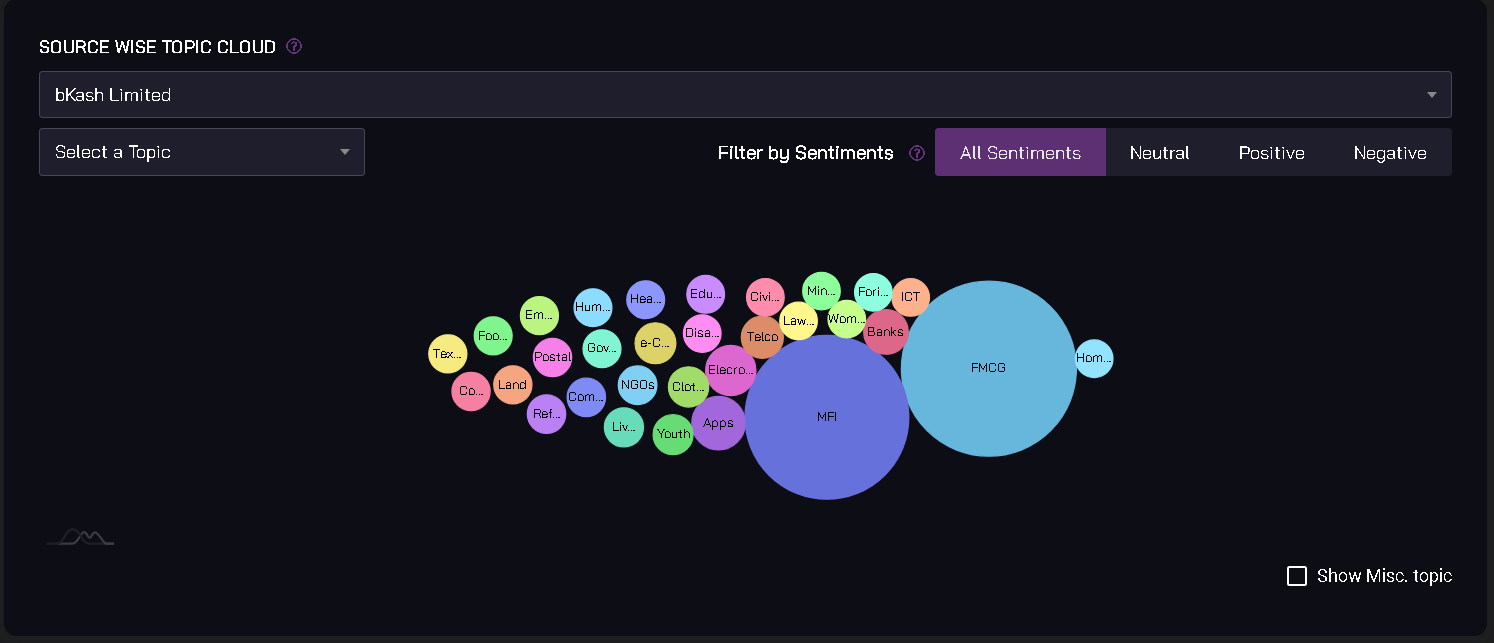 Visualize topic clouds specific to each source.
SOURCE WISE TOPIC TIMELINE
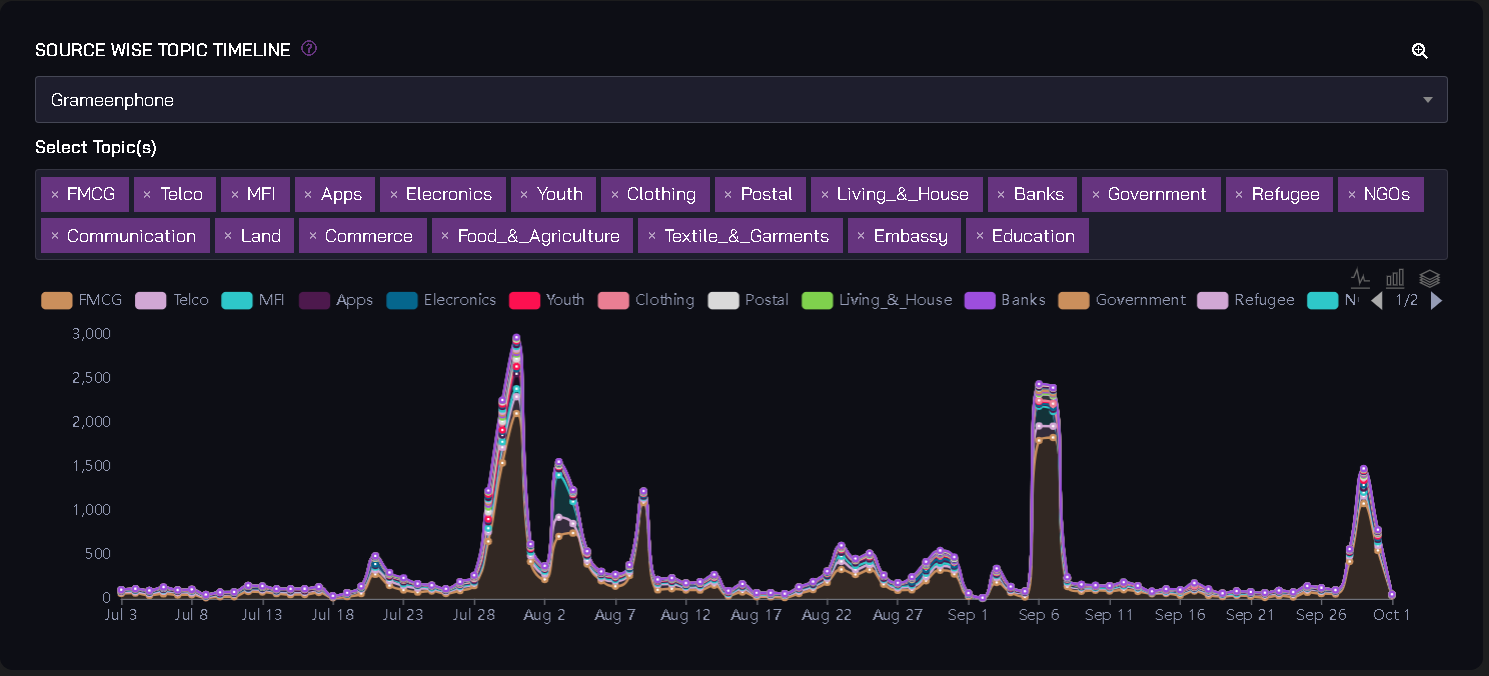 Explore the timeline of topics for each source.
TOPIC WISE SOURCE DISTRIBUTION
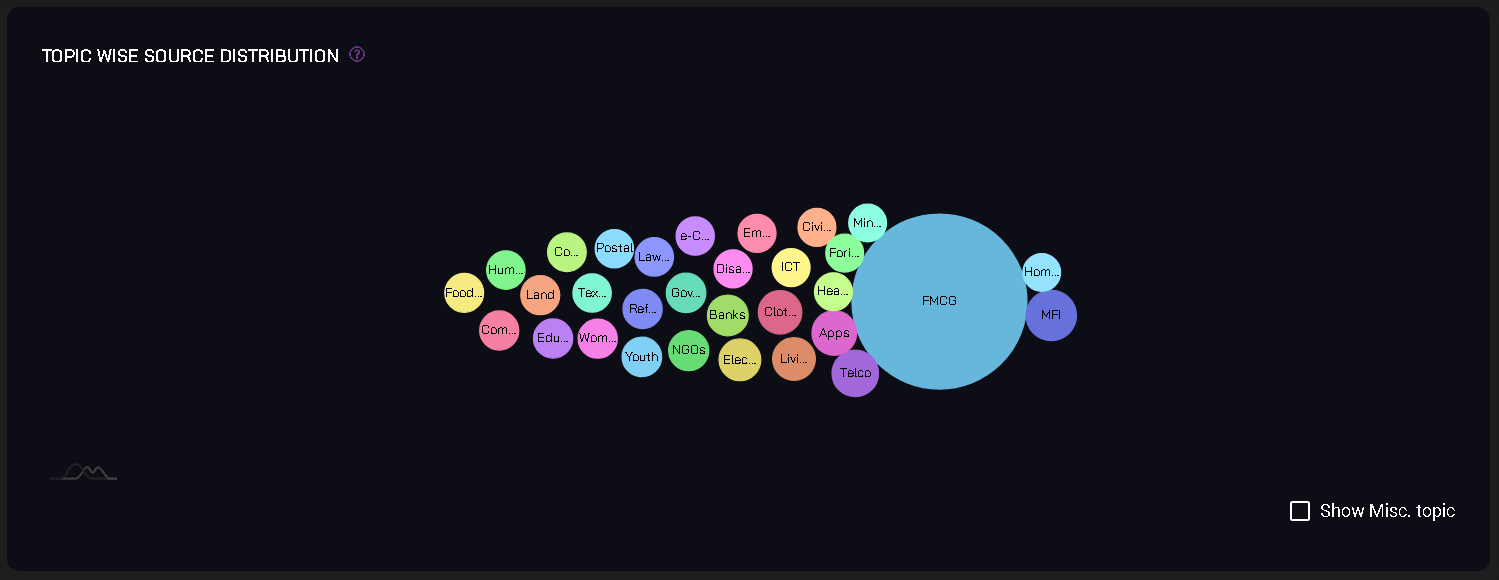 Understand how topics are distributed across sources.
SENTIMENT WISE SOURCE DISTRIBUTION
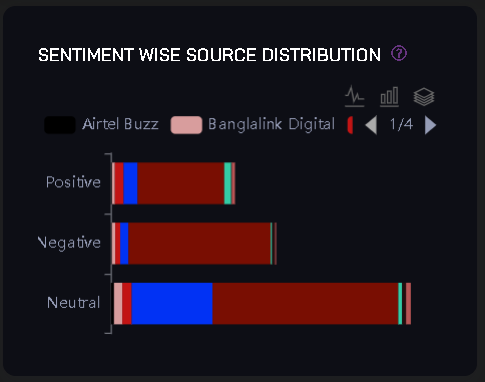 Analyze sentiment distribution across sources.
TOPIC TIMELINE FOR SOURCES
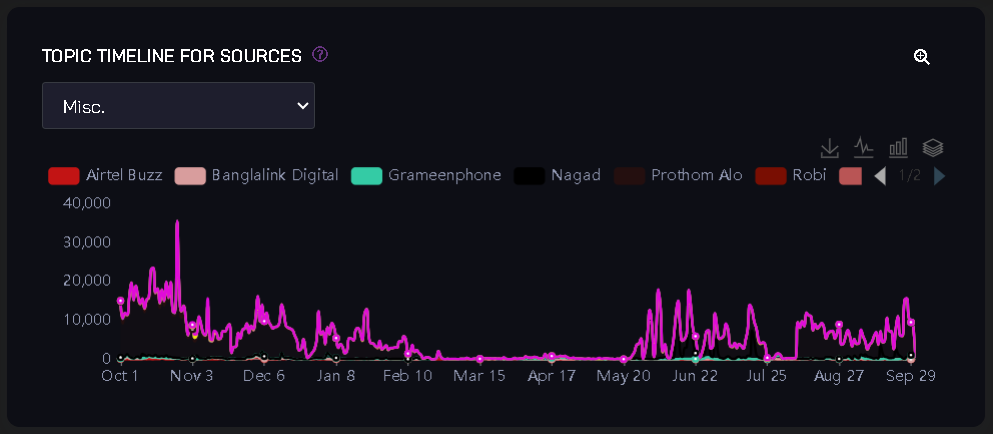 Visualize the topic timeline for all selected sources.
BUZZWORDS
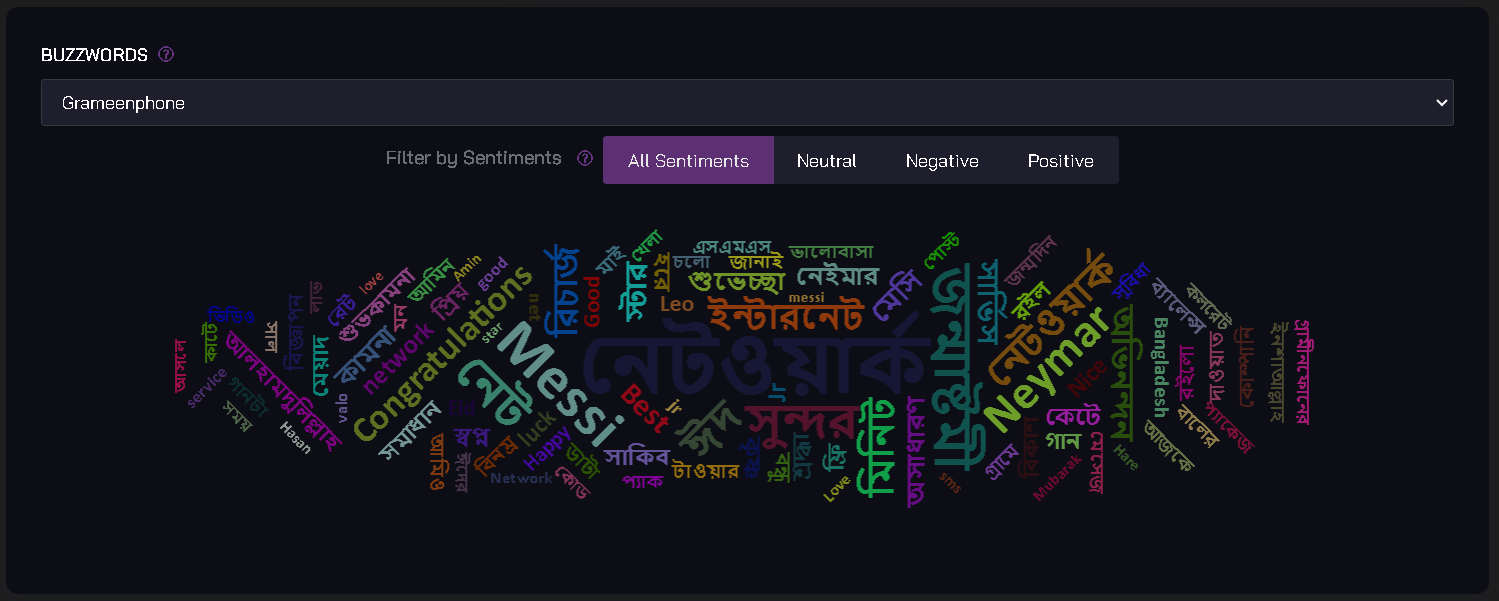 Identify trending buzzwords among the selected sources.
TOP INTERACTIVE POSTS (ALL SOURCES COMBINED)
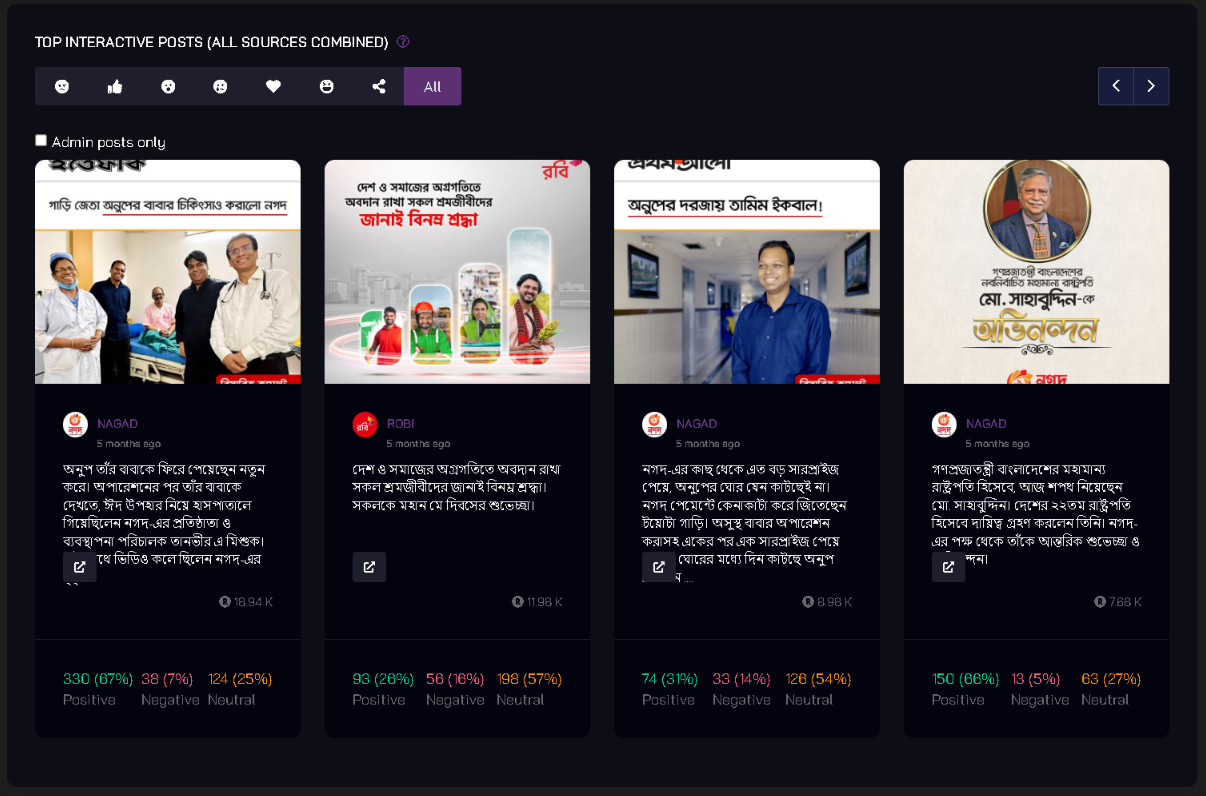 Discover the most interactive posts across all selected sources.
TOP INTERACTIVE POSTS FOR INDIVIDUAL SOURCE
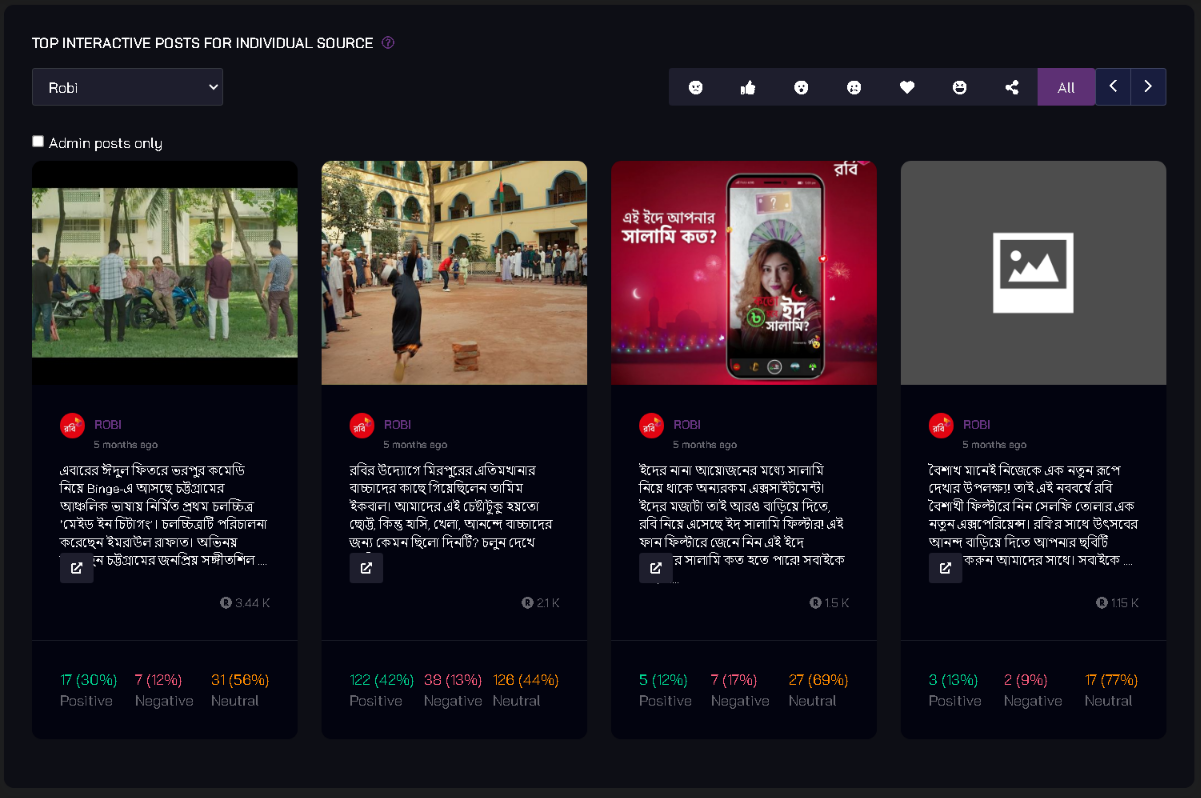 Find the top interactive posts for each individual source.
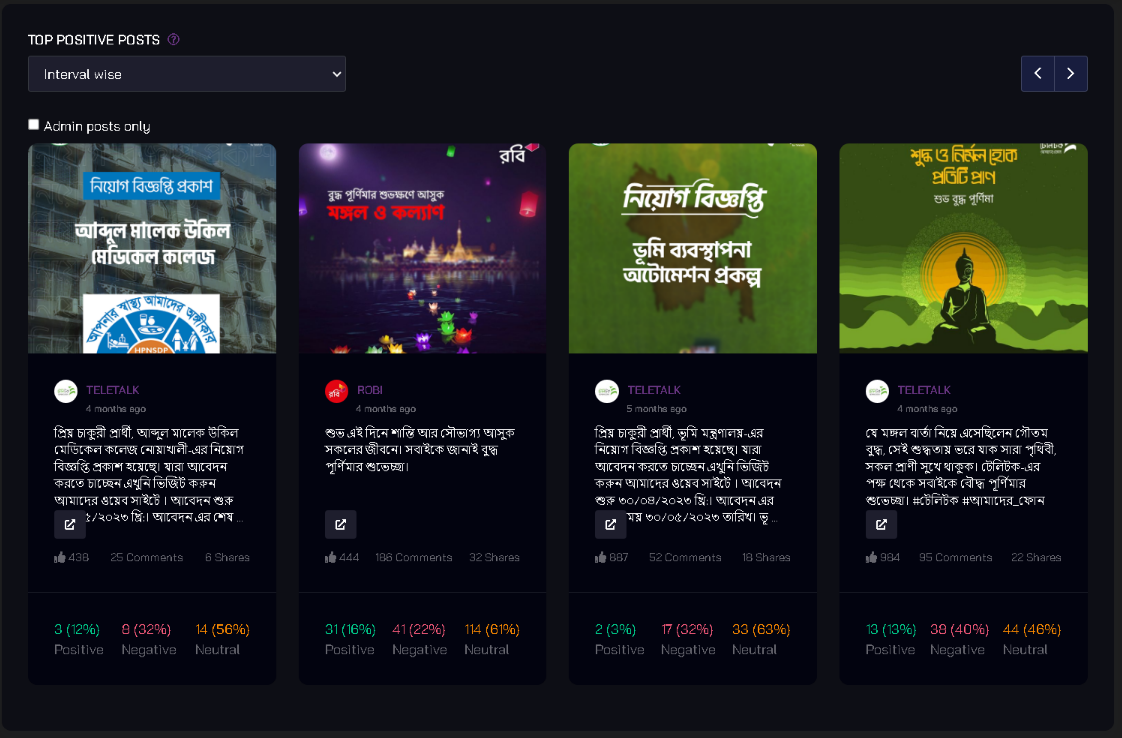
TOP POSITIVE POSTS (ALL SOURCES COMBINED)
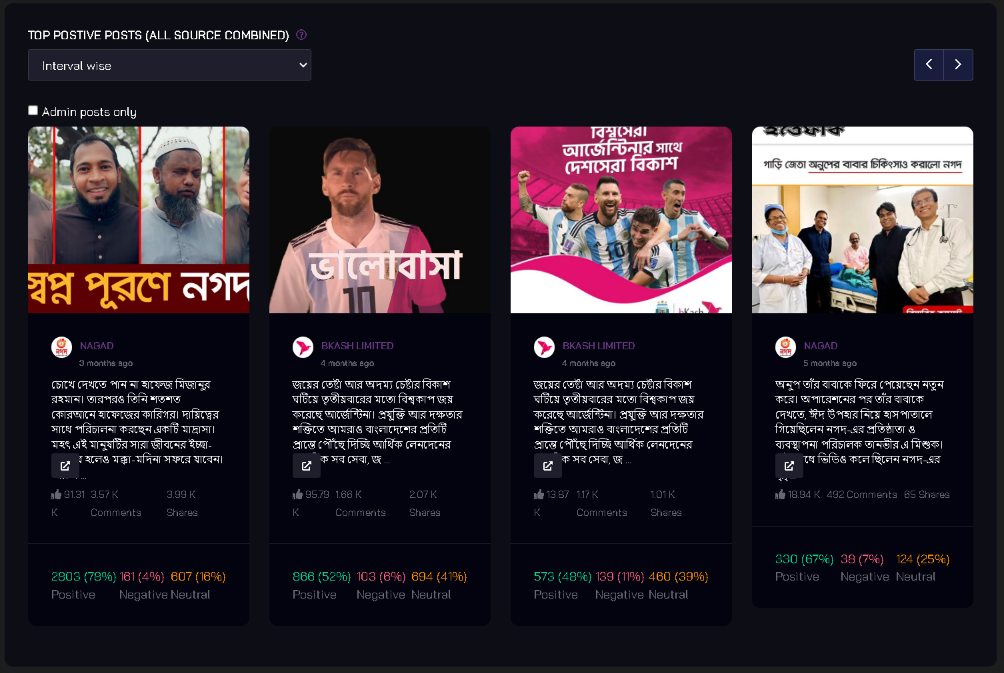 Locate the top positive posts across all selected sources.
TOP NEGATIVE POSTS (ALL SOURCES COMBINED)
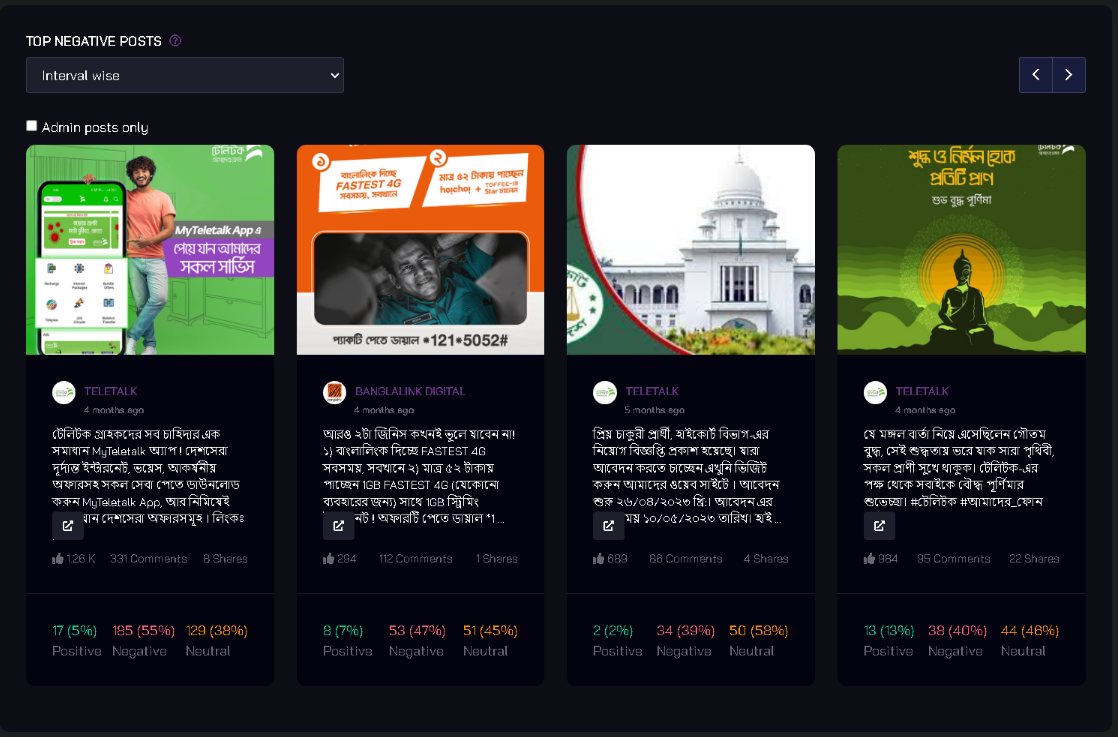
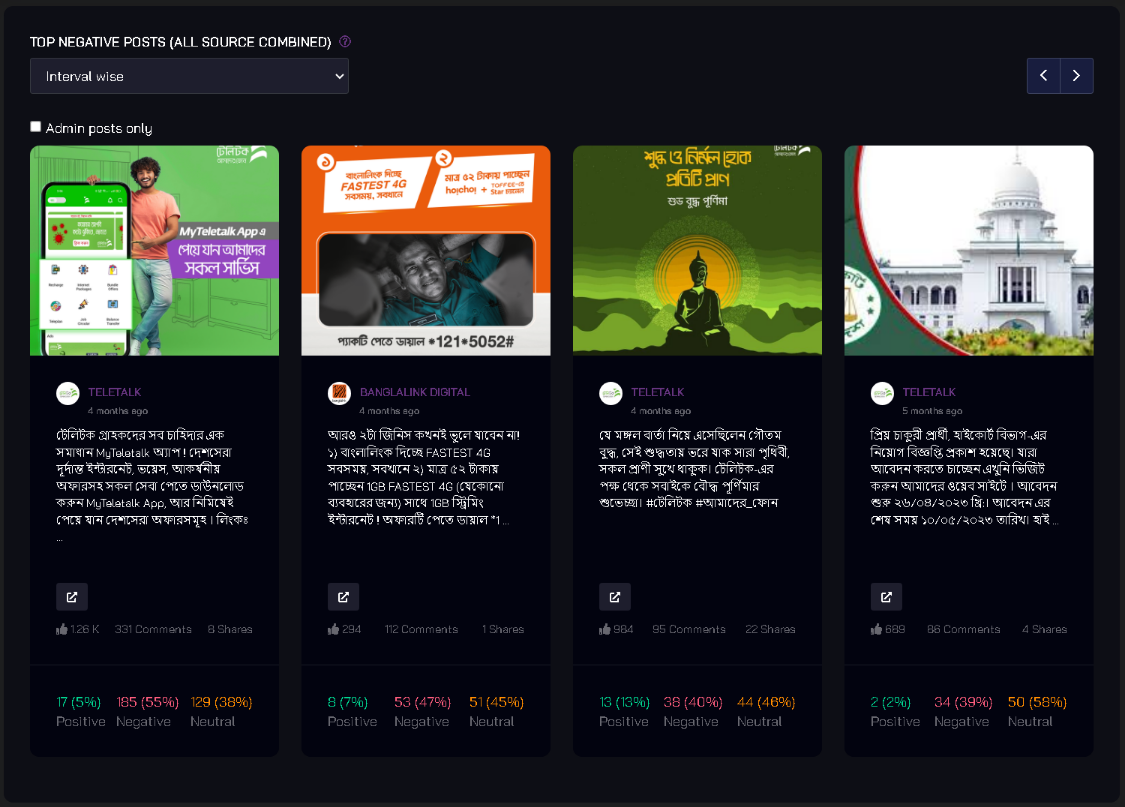 Identify the top negative posts across all selected sources.
TOP POSITIVE POSTS FOR INDIVIDUAL SOURCE
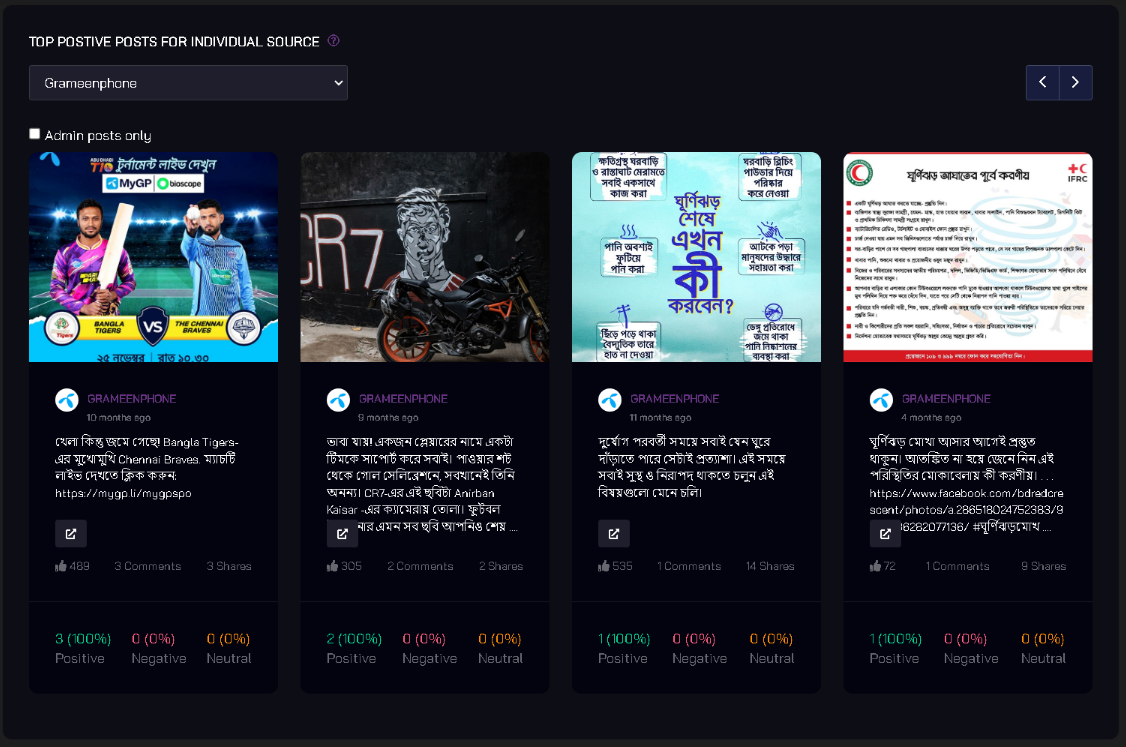 Find the top positive posts for each individual source.
TOP NEGATIVE POSTS FOR INDIVIDUAL SOURCE
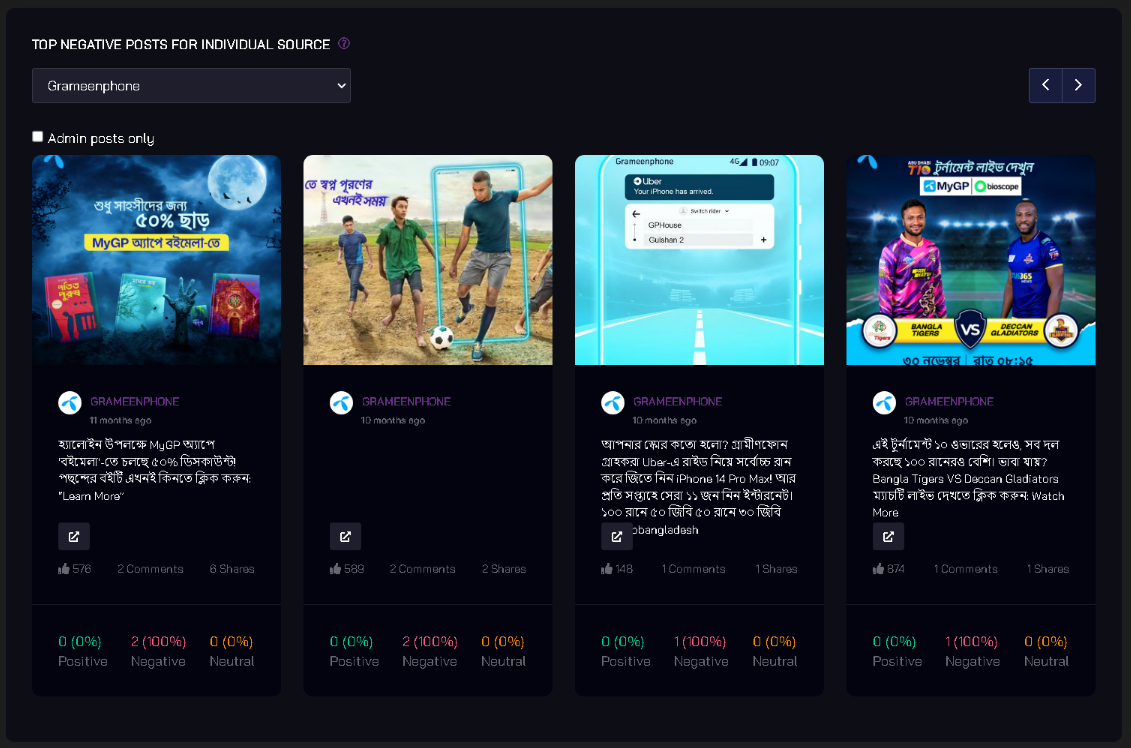 Discover the top negative posts for each individual source.
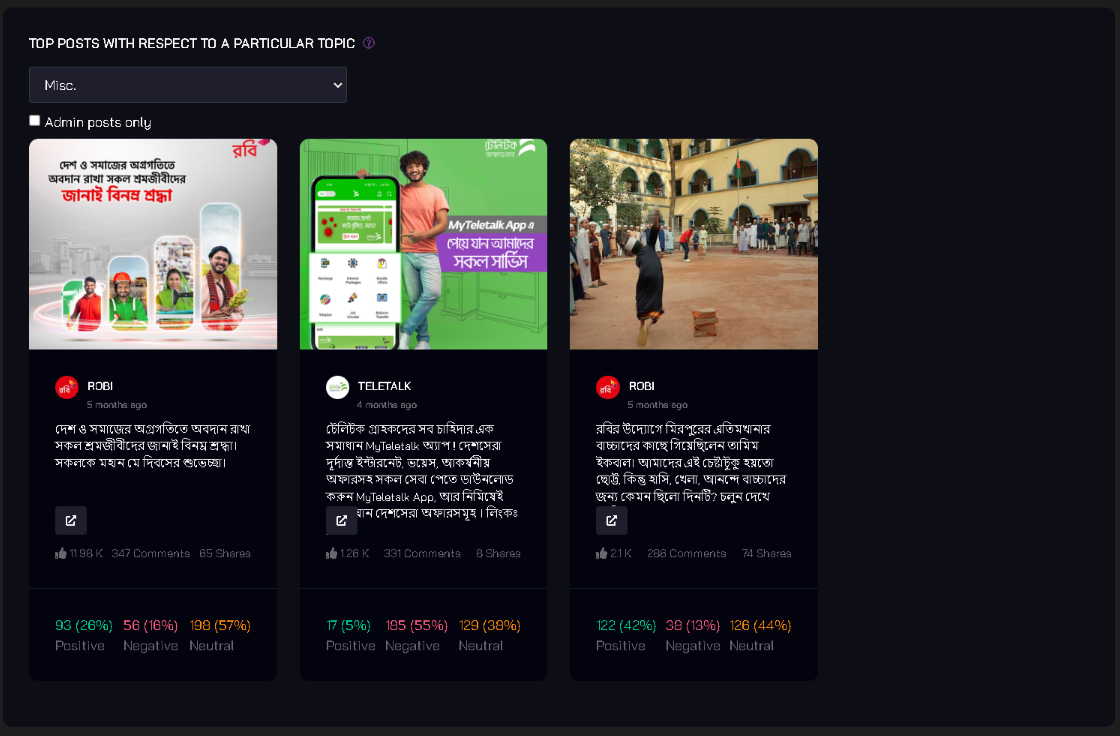
TOP POST WITH RESPECT TO A PARTICULAR TOPIC (ALL SOURCE COMBINED)
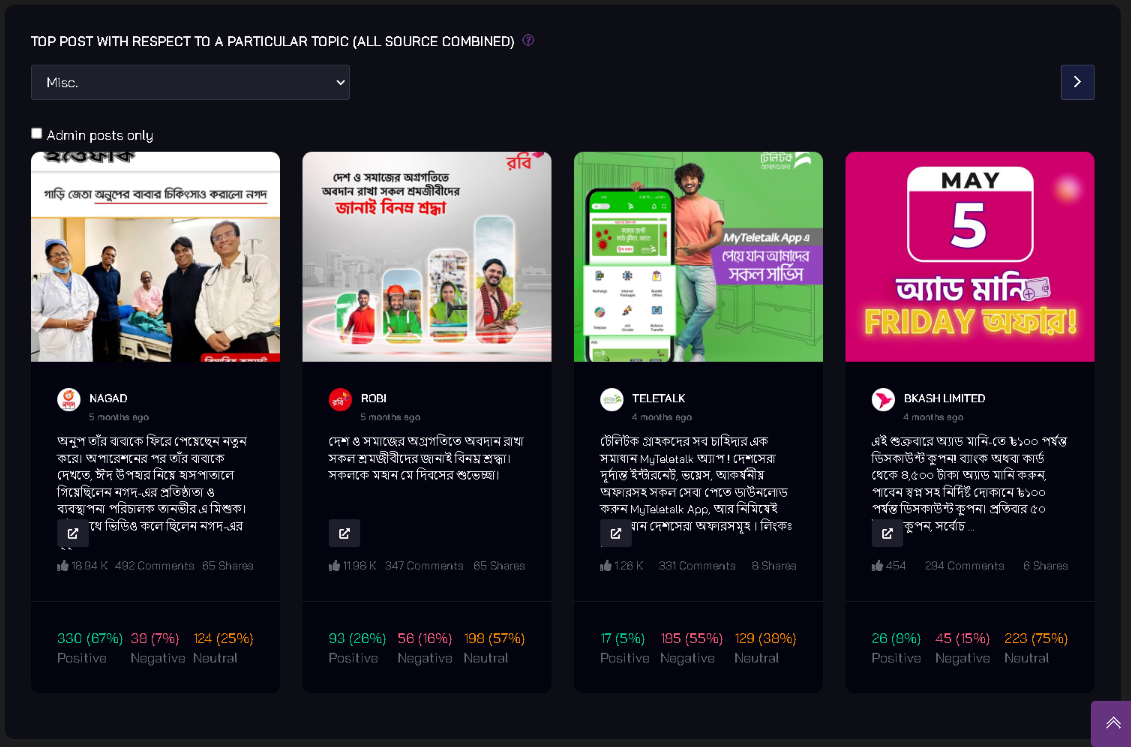 Identify the top posts related to a specific topic across all selected sources.
Export Full Page as PDF You can export the entire page, including all the charts, as a PDF document for comprehensive reporting. You can also send it via email directly from the platform.
When "Combine" Selected
When you choose the "Combine" option for your selected sources, you gain access to a consolidated overview of the combined data from those sources. This allows you to see an aggregated view of your sources, making it easier to identify patterns and trends across the board.
Source Overview Charts
ADMIN POSTS
 This chart provides an overview of administrative posts combined from all selected sources. You can analyze the content and engagement of these posts.
AUDIENCE POSTS
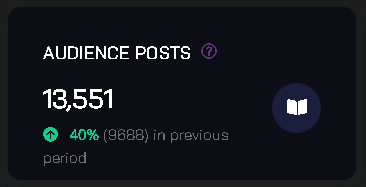 Examine audience-generated posts in a consolidated view. Understand what your audience is saying collectively.
AUDIENCE COMMENTS
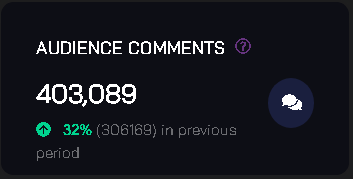 Dive into audience comments across all sources. This helps you grasp the overall sentiment and engagement from your audience.
REACTIONS
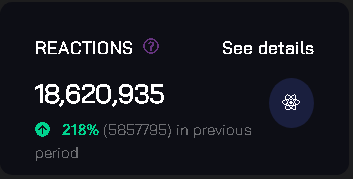 Track reactions (likes, shares, comments) for all selected sources combined. Understand the total engagement across all sources.
POST AND COMMENT TIMELINE
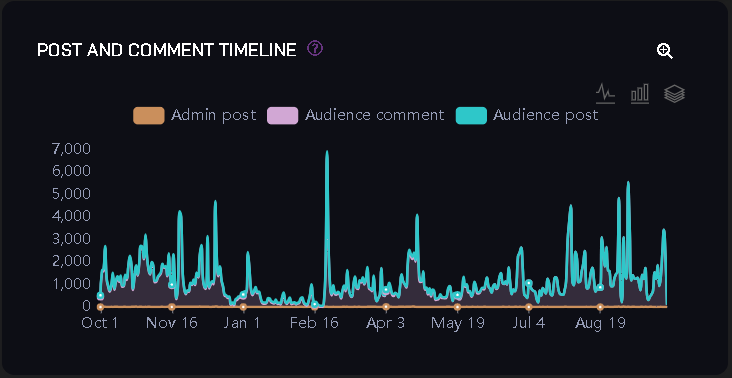 Visualize the timeline of posts and comments in a unified view. This helps you identify spikes and trends in activity.
FAN COUNT TIMELINE (IN MILLION)
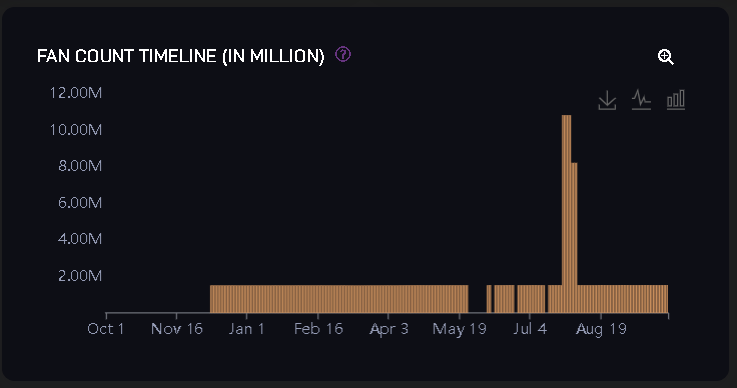 Explore the growth of fan counts over time for all sources. Monitor audience growth patterns.
SOURCE TYPE DISTRIBUTION
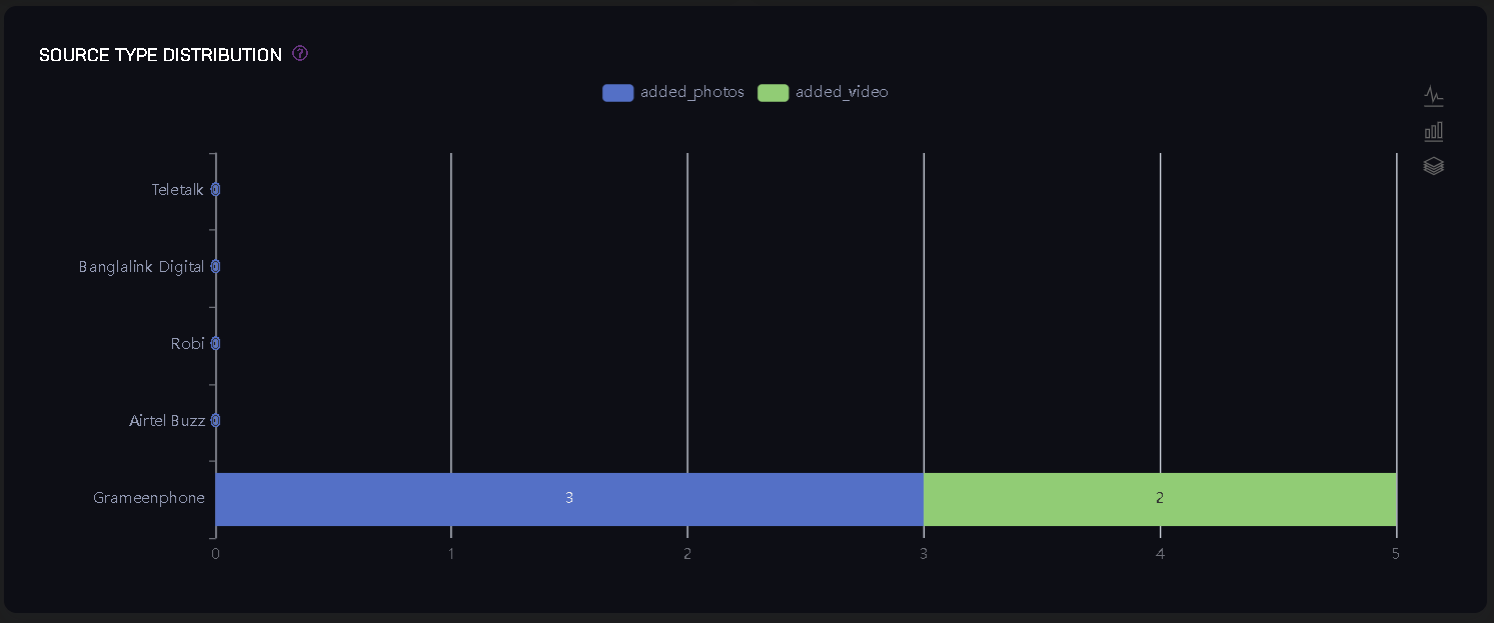 Analyze the distribution of source types across all selected sources. Understand the mix of sources contributing to your data.
MOST ENGAGING POST TYPE
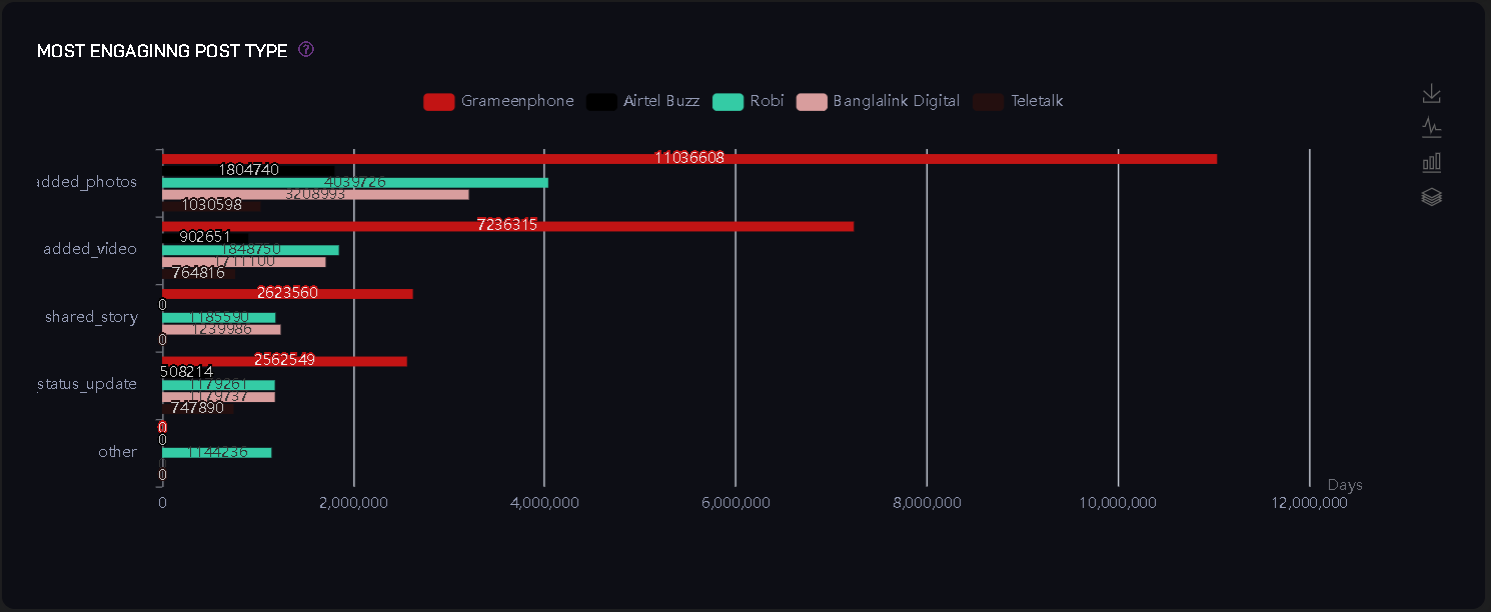 Identify the most engaging post types when considering all sources together. This helps in content strategy decisions.
SOURCE INFO TIMELINE
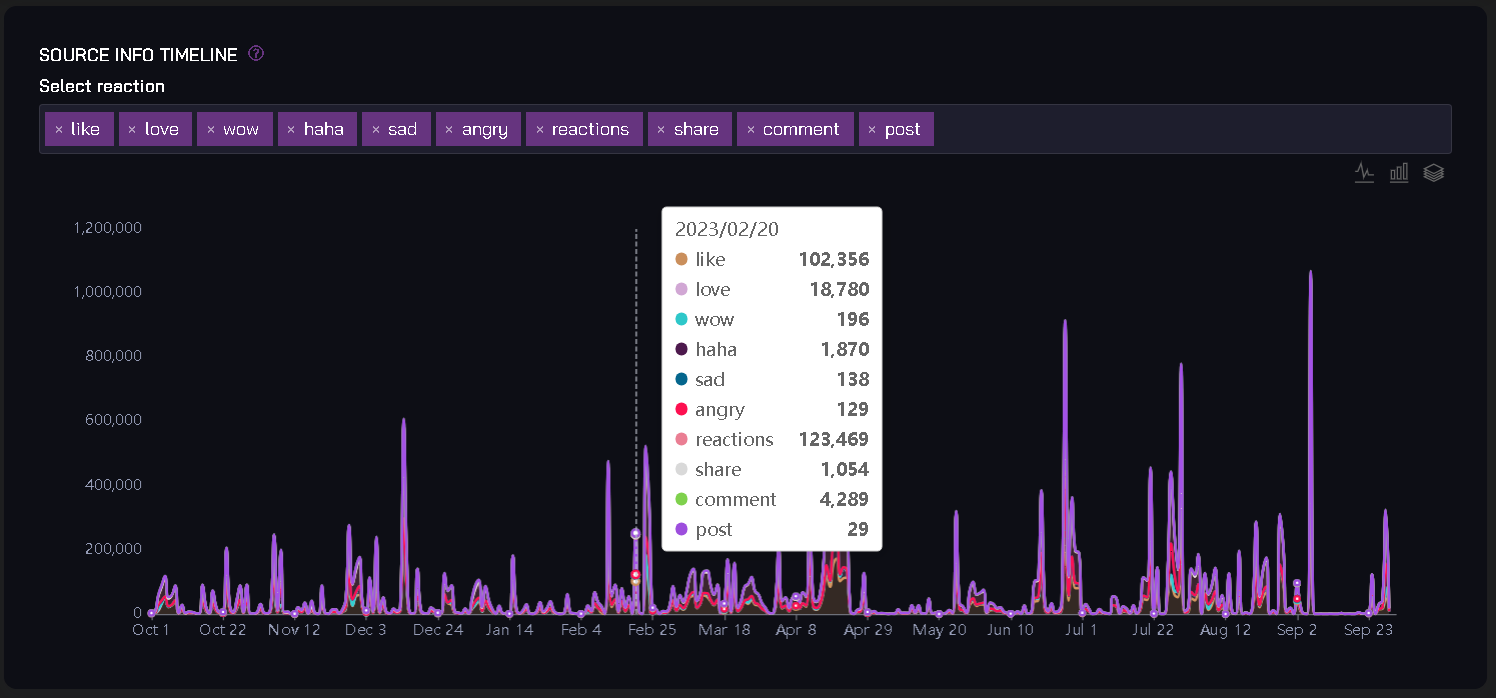 Visualize the timeline of source information updates for all sources. Track changes and updates over time.
Ratio Analysis
FOLLOWERS RATIO
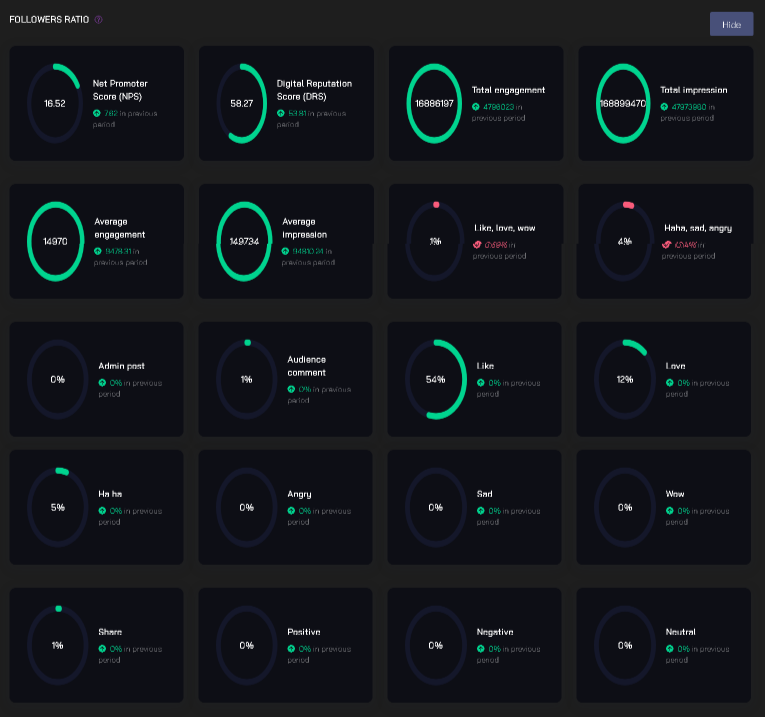 Analyze the follower-to-following ratio across all sources. Understand the audience structure for combined sources.
ENGAGEMENT RATIO
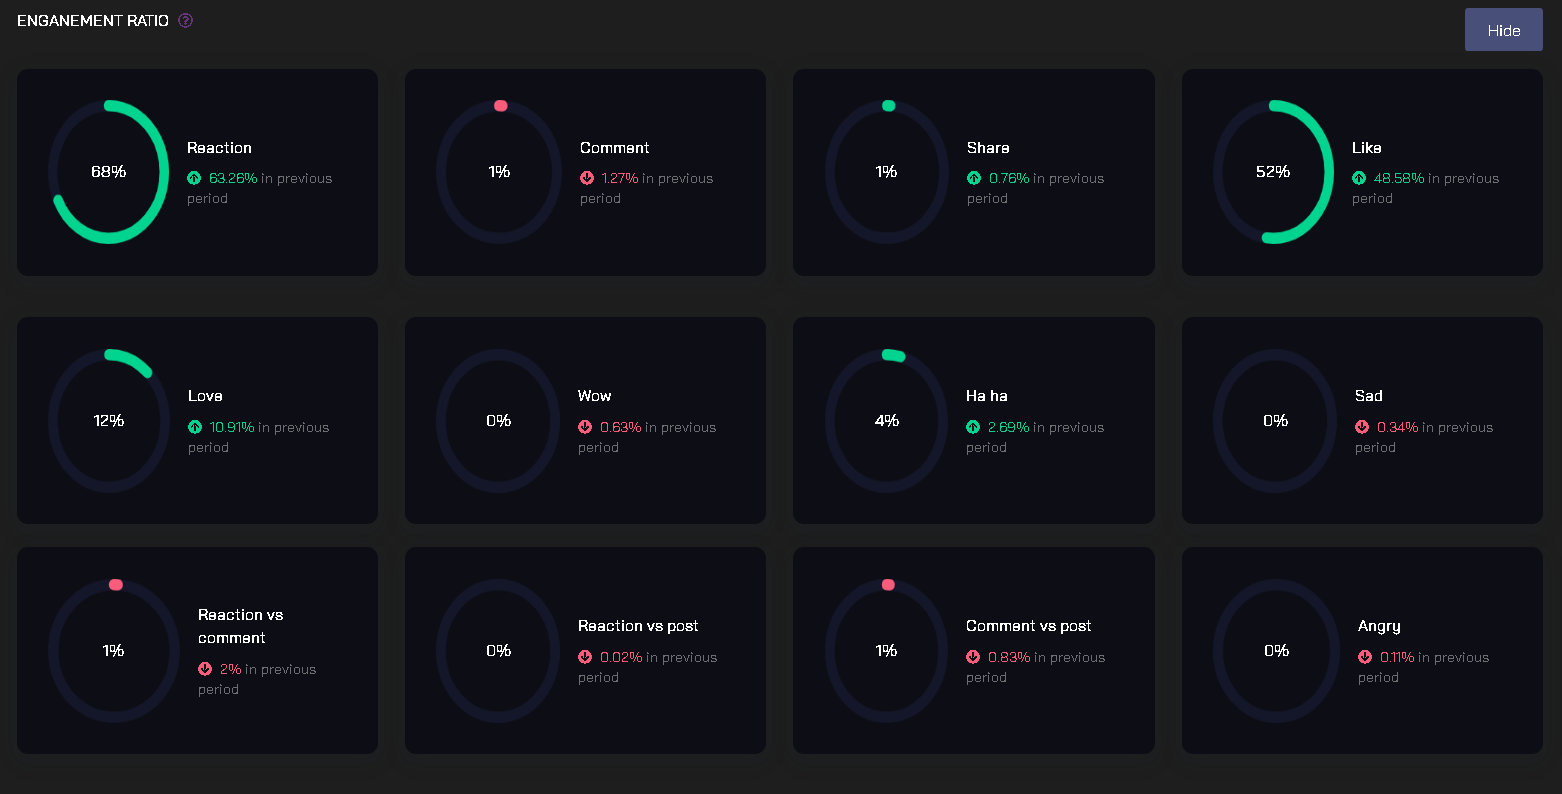 Evaluate the engagement-to-follower ratio for all selected sources. Determine the level of engagement for combined sources.
Topic
TOPIC CLOUD
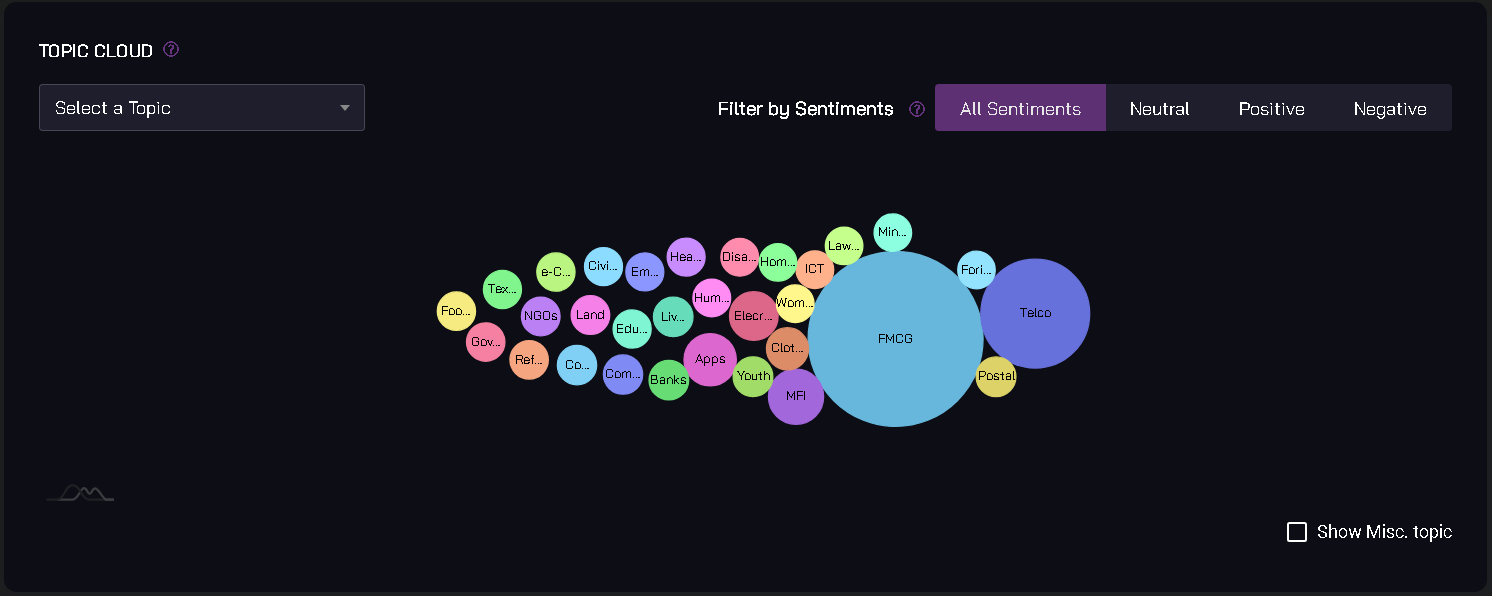 Visualize a consolidated topic cloud that represents the most discussed topics across all selected sources.
TOPIC TIMELINE
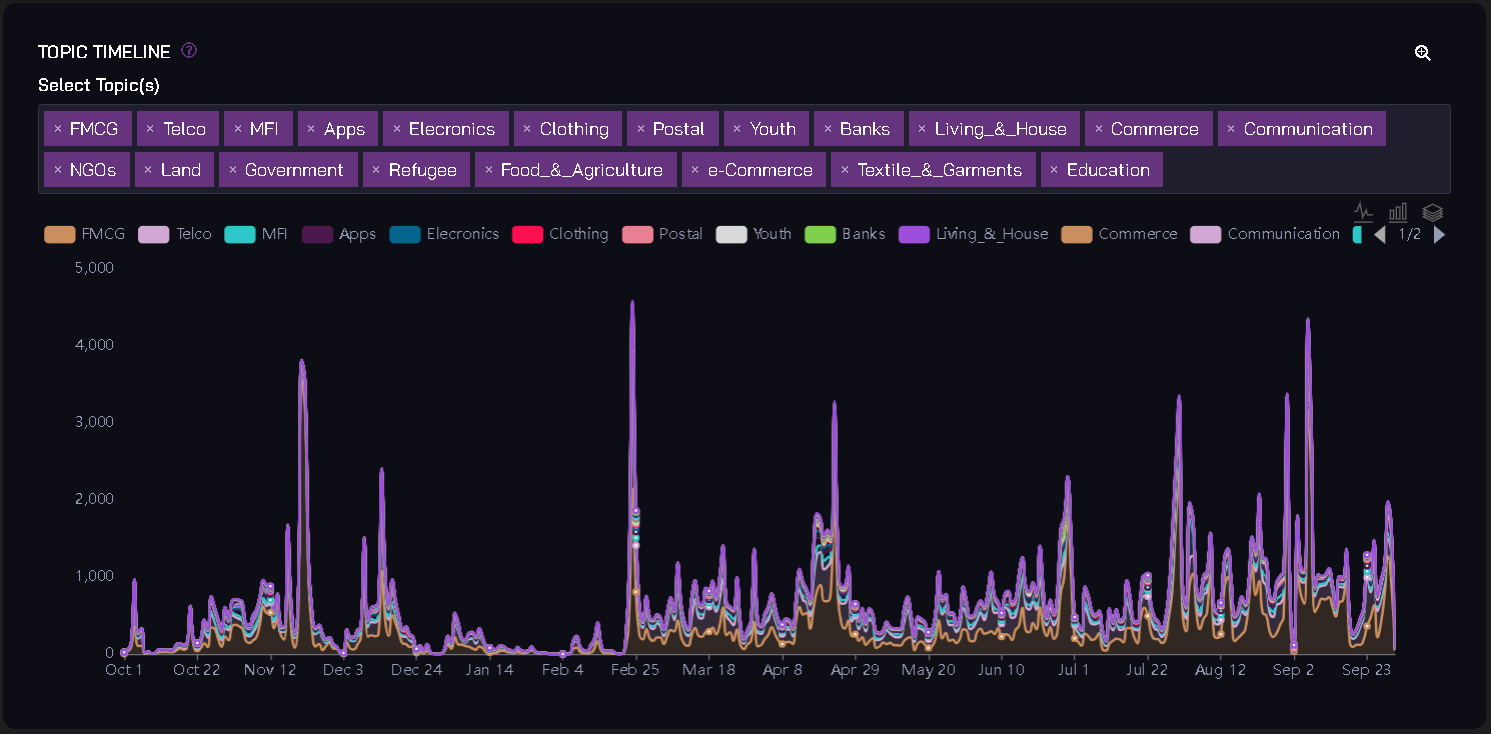 Explore the timeline of topics across combined sources. Understand how topic trends evolve over time.
SHARE OF PRODUCTS
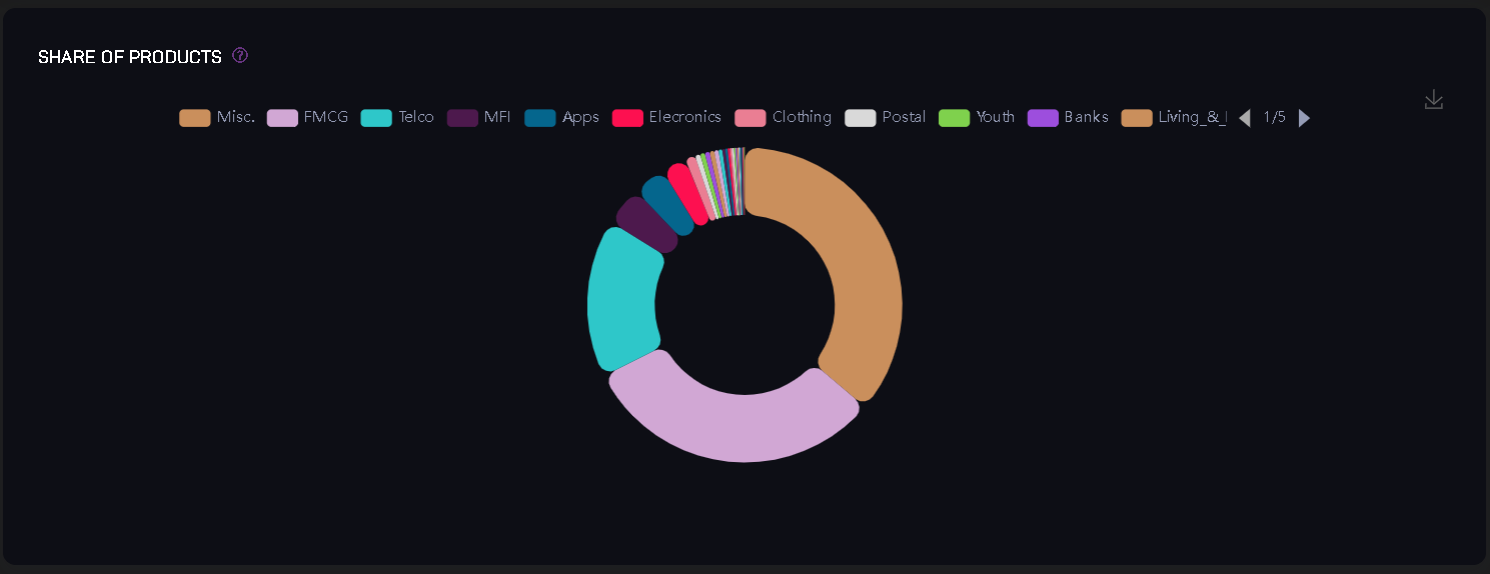 Analyze the distribution of shared products across all selected sources combined. Identify popular products.
Sentiment
POSITIVE SENTIMENT
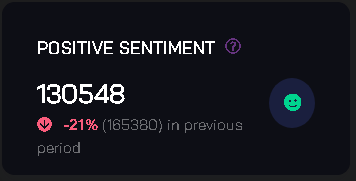 Understand the overall positive sentiment across all selected sources when combined.
NEGATIVE SENTIMENT
 Evaluate the overall negative sentiment across combined sources.
SENTIMENT TIMELINE
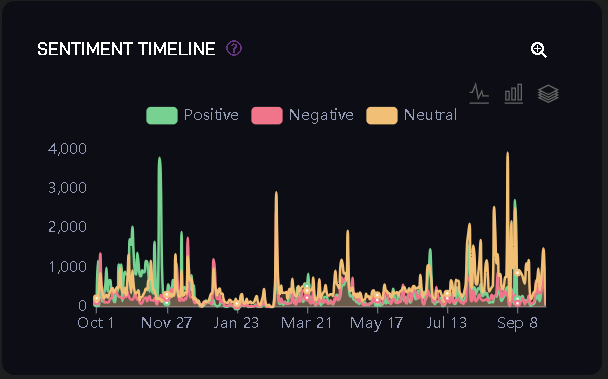 Visualize how sentiment changes over time for combined sources. Track sentiment trends.
SENTIMENT DISTRIBUTION
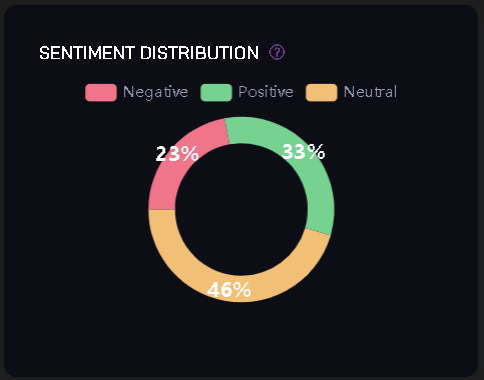 Analyze the distribution of sentiment (positive, negative, neutral) across all sources combined.
SENTIMENT BREAKDOWN
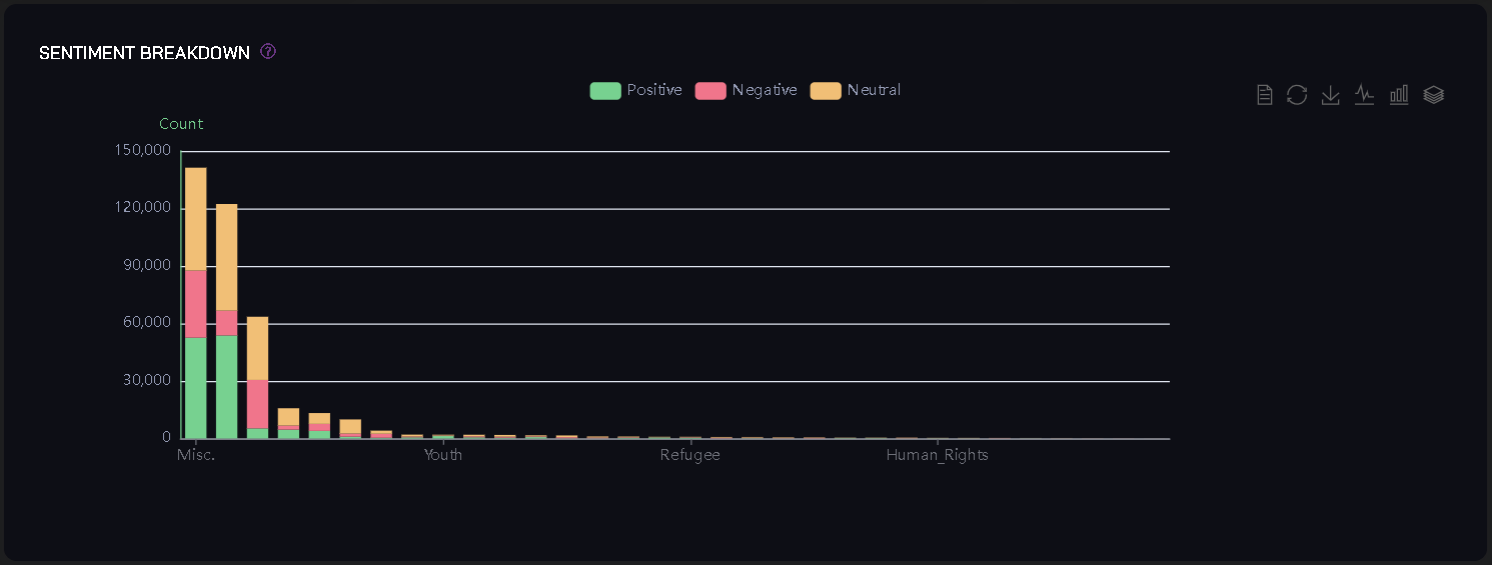 Get a breakdown of sentiment categories (e.g., joy, anger) across all selected sources when combined.
BUZZWORDS
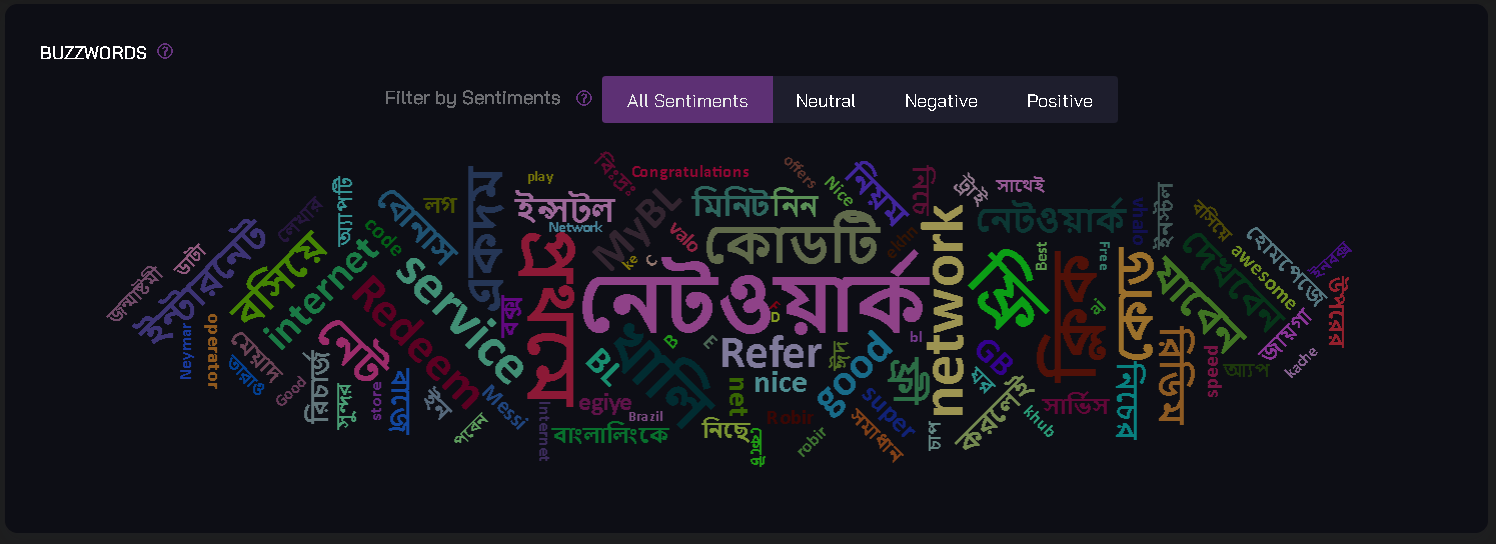 Identify trending buzzwords within the combined sources. Stay updated on popular terms.
Ranked Posts
TOP INTERACTIVE POSTS
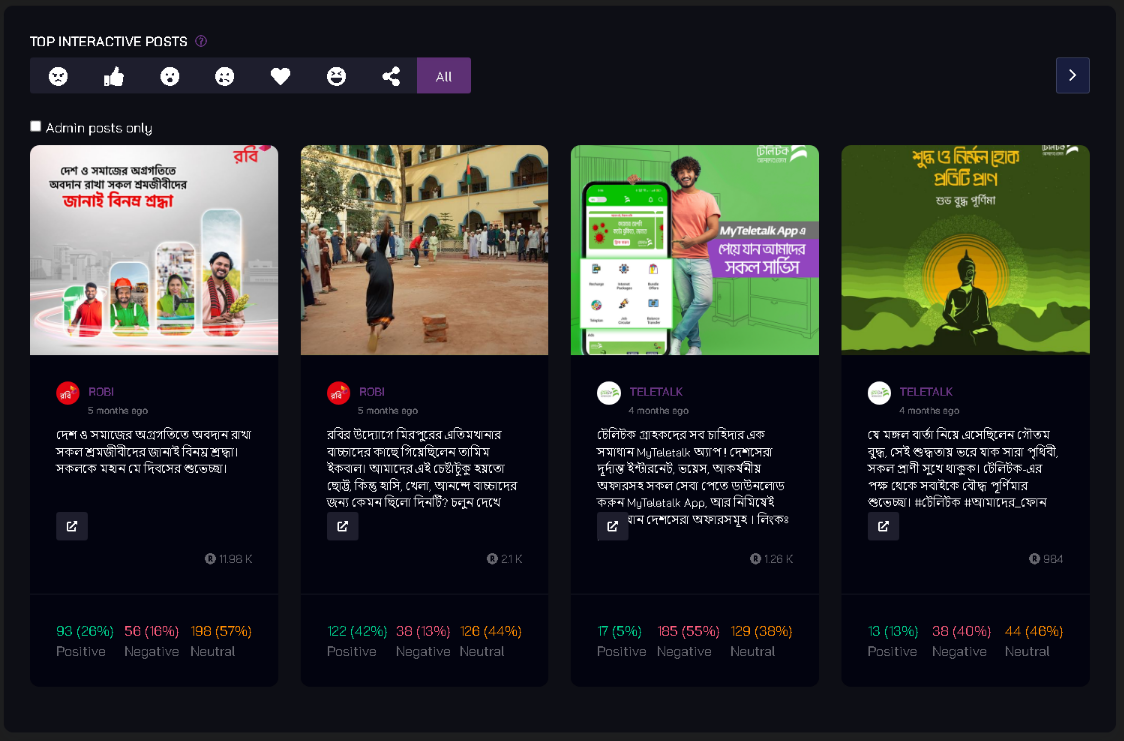 Discover the most interactive posts across all selected sources when combined.
TOP POSITIVE POSTS
 Locate the top positive posts across all selected sources when combined.
TOP NEGATIVE POSTS
 Identify the top negative posts across all selected sources when combined.
TOP POST WITH RESPECT TO A PARTICULAR TOPIC (ALL SOURCE COMBINED)
 Find the top posts related to a specific topic across all selected sources when combined.
Audience Activity
- Comment List Access a combined list of comments from all sources. Explore audience interactions collectively.
Export Full Page as PDF
Similar to the "Compare" option, you can export the entire page, including all the charts, as a PDF document for comprehensive reporting. You can also send it via email directly from the platform.