3.3.4 Reports
Overview
The "Reports" feature provides valuable insights into your platform's performance, including data from the last 24 hours, marketing reports, business reports, and actionable insights. This documentation will guide you through accessing and utilizing these reports effectively.
Viewing Reports
1. Accessing Reports
To access the Reports section, follow these steps:
- Log in to your account.
- Navigate to the main dashboard or analytics section of your platform.
- Look for the "Reports" tab or option.
2. Report Types
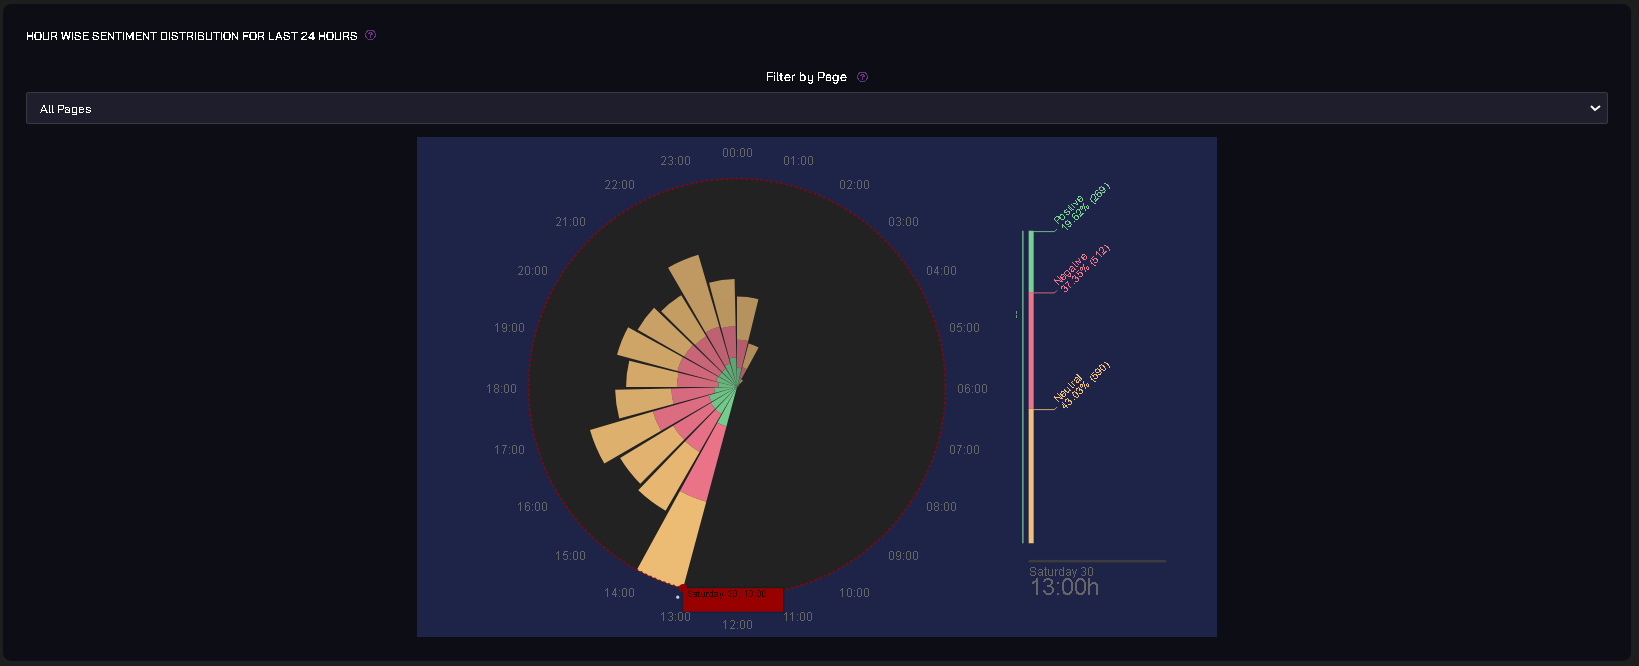
a. Last 24 Hours
The "Last 24 Hours" report provides a snapshot of platform activity and performance over the past day. It includes key metrics such as user engagement, content views, and more.
- Example Chart:
b. Marketing Report
The "Marketing Report" offers insights into your marketing campaigns' effectiveness. It includes data on click-through rates, conversion rates, and the performance of various marketing channels.
c. Business Report
The "Business Report" focuses on financial and business-related metrics. This report includes revenue data, user subscriptions, and other financial insights crucial for decision-making.
d. Actionable Report
The "Actionable Report" provides actionable insights and recommendations based on your platform's data. It highlights areas that require attention and suggests strategies for improvement.
3. Customization
Depending on your platform's capabilities, you may have options to customize the reports by selecting specific time frames, data sources, or filters.
Conclusion
The "Reports" feature is a powerful tool for monitoring and optimizing your platform's performance. By regularly reviewing these reports, you can make informed decisions to enhance user engagement, marketing strategies, business operations, and overall platform success.