3.3.5 Sources
Overview
The "Sources" section provides detailed insights into individual pages or sources within your platform. This documentation will guide you through the various functionalities and charts available in this section.
Functionalities and Charts
Source Overview
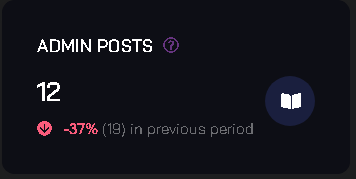
1. ADMIN POSTS
- Description: This chart displays data related to posts made by administrators of the source. It includes post frequency, engagement metrics, and content types.
- Example Chart:
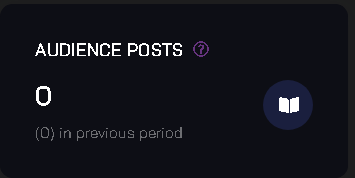
2. AUDIENCE POSTS
- Description: The "AUDIENCE POSTS" chart presents information about posts created by the audience of the source. It provides insights into user-generated content, trends, and engagement.
- Example Chart:
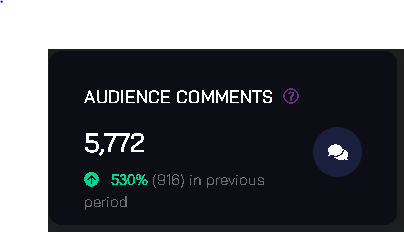
3. AUDIENCE COMMENTS
- Description: This chart focuses on audience comments on the source's posts. It includes comment activity, sentiment analysis, and top commenters.
- Example Chart:
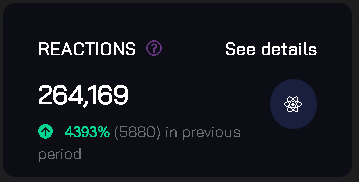
4. REACTIONS
- Description: The "REACTIONS" chart displays data regarding reactions (e.g., likes, dislikes) on posts. It helps assess the audience's sentiment towards content.
- Example Chart:
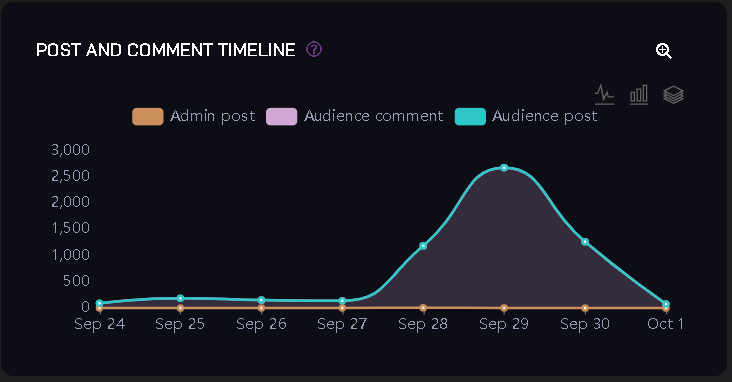
5. POST AND COMMENT TIMELINE
- Description: This timeline provides a chronological view of both posts and comments. It aids in tracking engagement patterns over time.
- Example Chart:
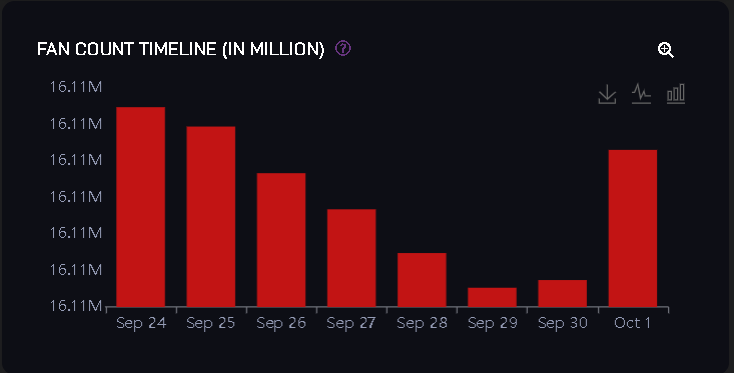
6. FAN COUNT TIMELINE (IN MILLION)
- Description: The "FAN COUNT TIMELINE" chart visualizes the growth of the source's fan base over time, measured in millions.
- Example Chart:
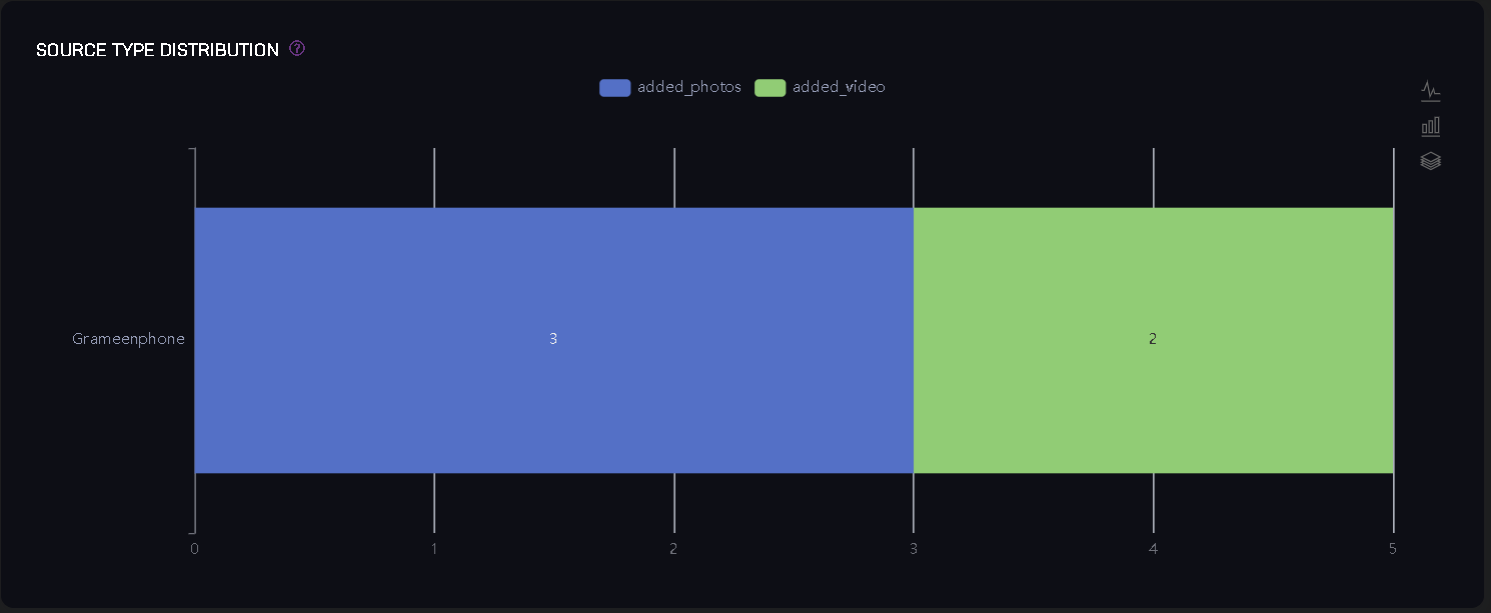
7. SOURCE TYPE DISTRIBUTION
- Description: This chart illustrates the distribution of source types within the platform, categorizing them by type (e.g., user profiles, groups, pages).
- Example Chart:
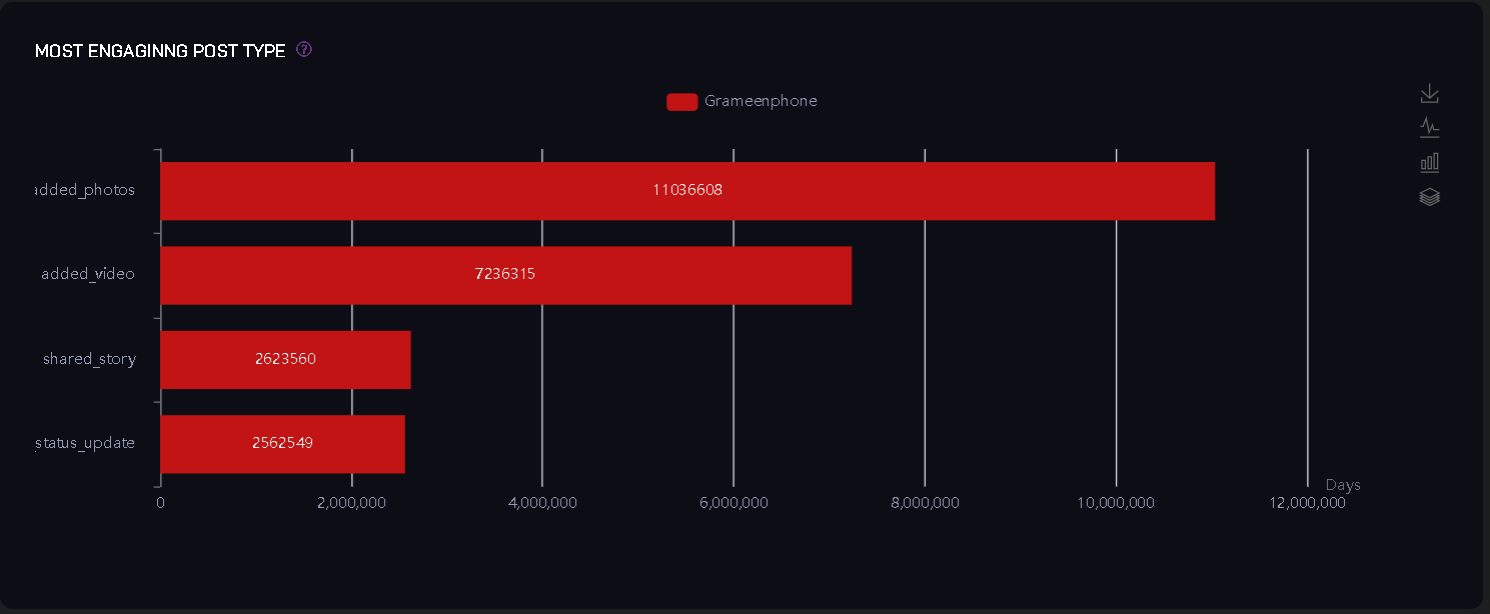
8. MOST ENGAGING POST TYPE
- Description: Identify the most engaging post types on the source. This chart helps optimize content strategy.
- Example Chart:
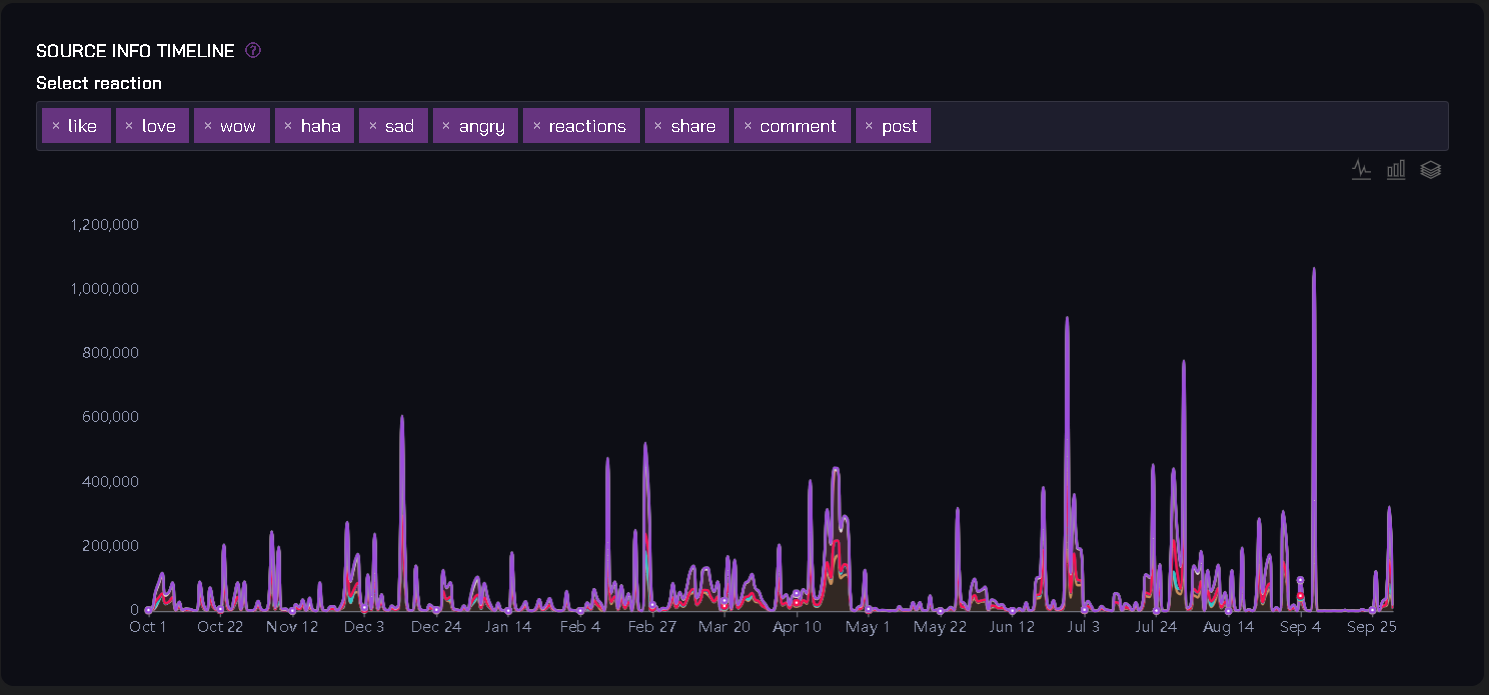
9. SOURCE INFO TIMELINE
- Description: The "SOURCE INFO TIMELINE" chart tracks changes to the source's information over time.
- Example Chart:
Ratio Analysis
10. FOLLOWERS RATIO
Calculate the followers-to-following ratio for the source, helping assess its influence.
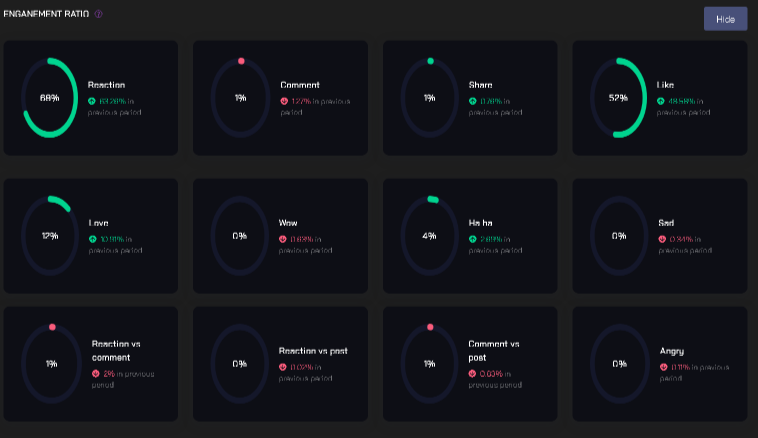
11. ENGAGEMENT RATIO
- Description: The "ENGAGEMENT RATIO" chart quantifies user engagement relative to the source's followers.
- Example Chart:
Topic
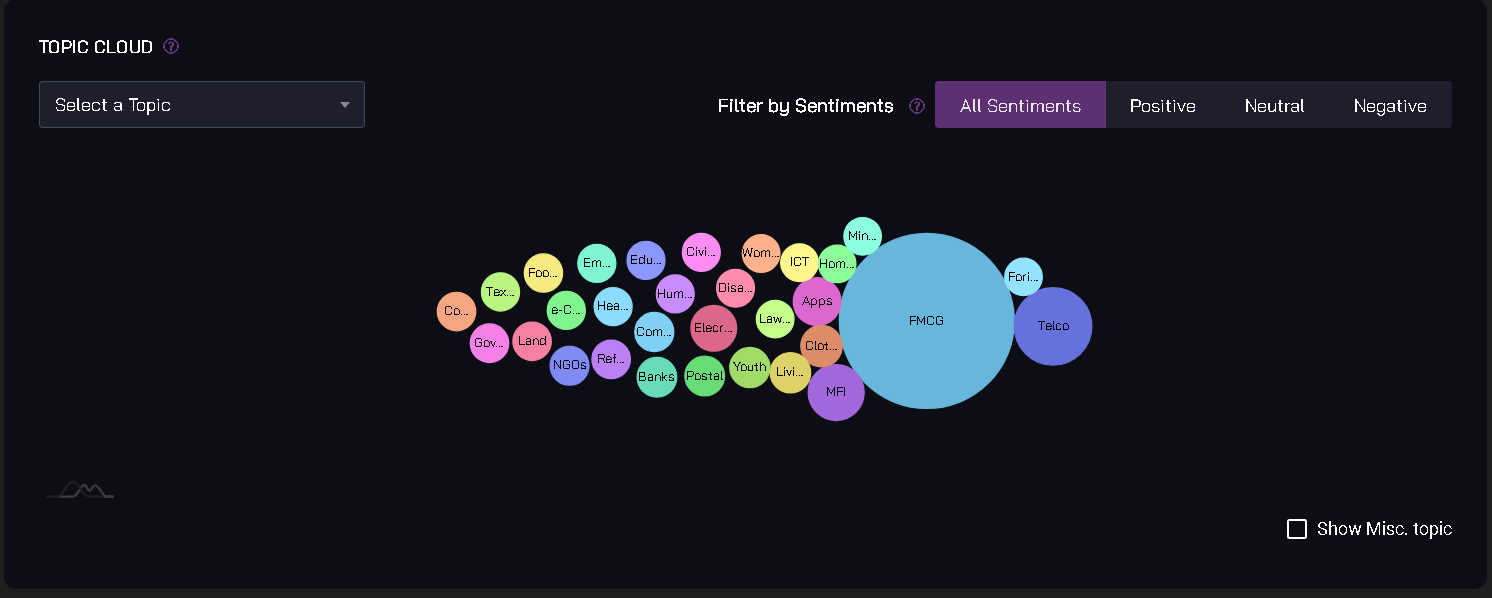
12. TOPIC CLOUD
- Description: Visualize the most discussed topics in a word cloud format.
- Example Chart:
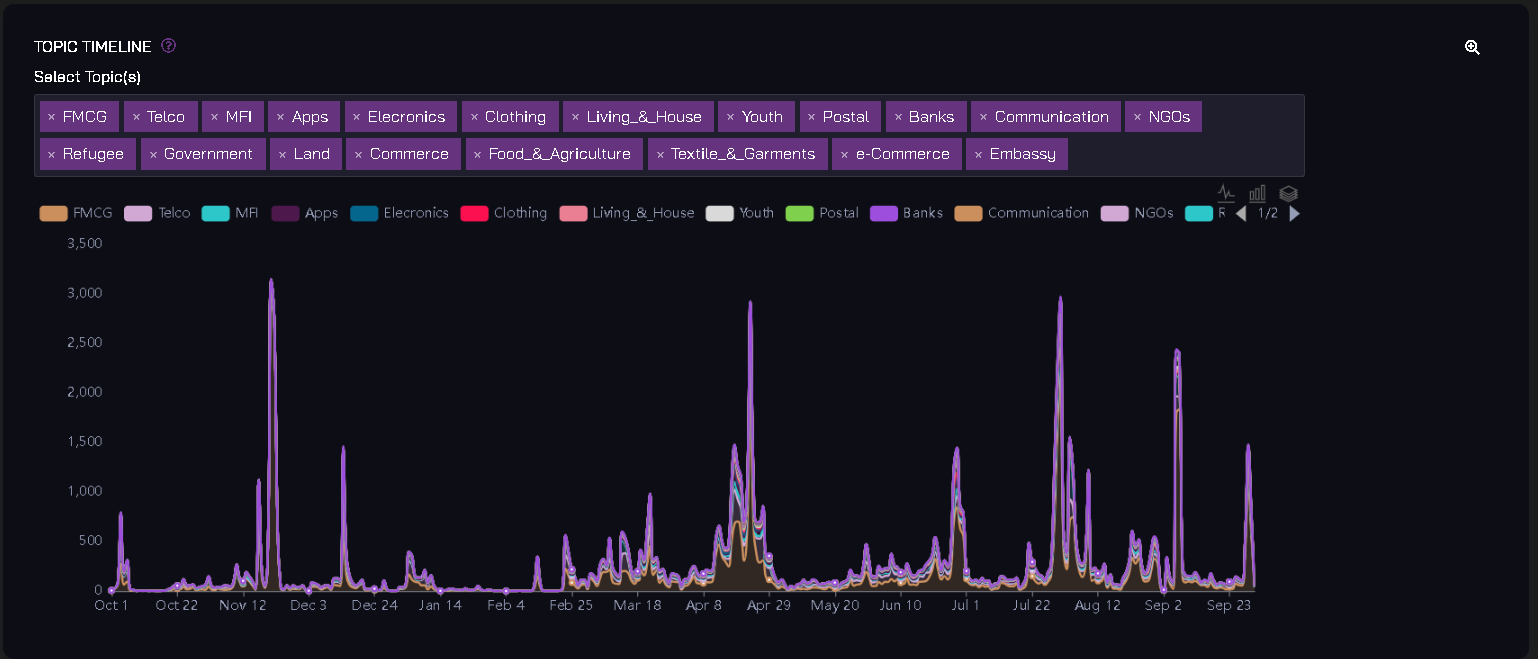
13. TOPIC TIMELINE
- Description: Track the evolution of topics discussed on the source over time.
- Example Chart:
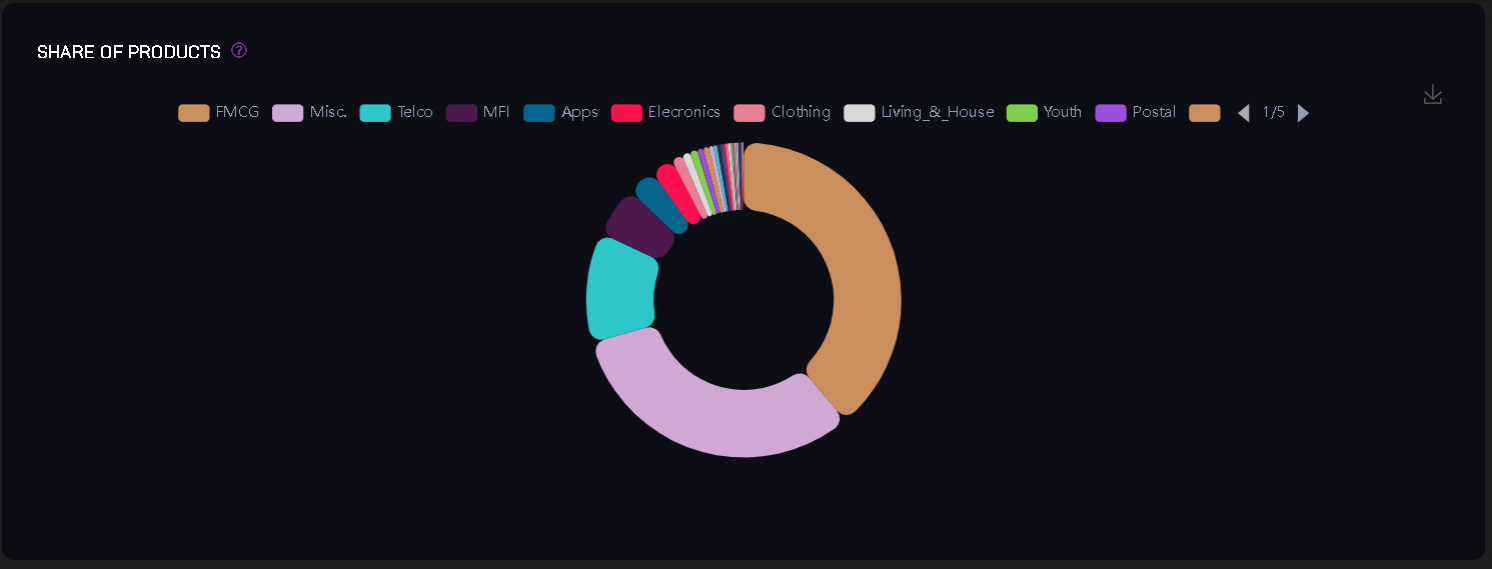
14. SHARE OF PRODUCTS
- Description: Analyze the share of different products or categories discussed on the source.
- Example Chart:
Sentiment
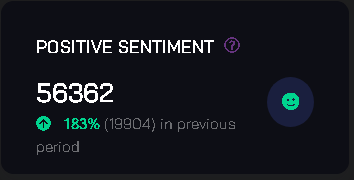
15. POSITIVE SENTIMENT
- Description: Identify and quantify positive sentiment expressed on the source.
- Example Chart:
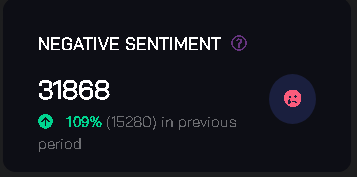
16. NEGATIVE SENTIMENT
- Description: Track and measure negative sentiment expressed on the source.
- Example Chart:
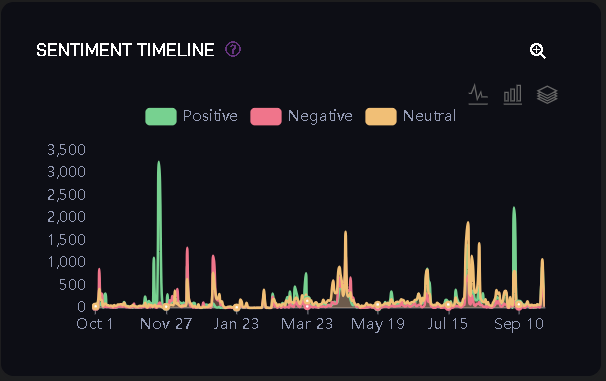
17. SENTIMENT TIMELINE
- Description: Observe changes in sentiment over time through this timeline chart.
- Example Chart:
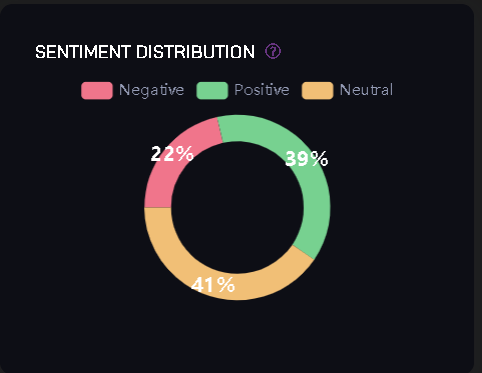
18. SENTIMENT DISTRIBUTION
- Description: This chart provides a breakdown of sentiment distribution across the source's content.
- Example Chart:
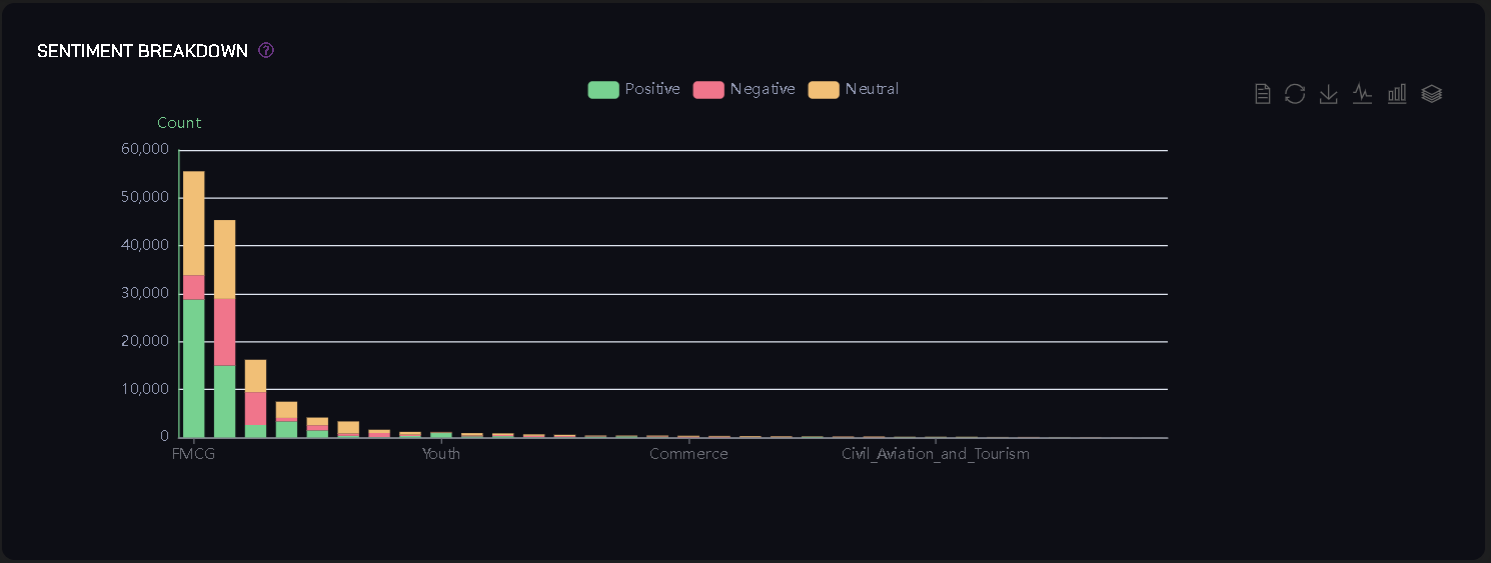
19. SENTIMENT BREAKDOWN
- Description: Explore sentiment analysis in detail with a breakdown of positive, neutral, and negative sentiment.
- Example Chart:
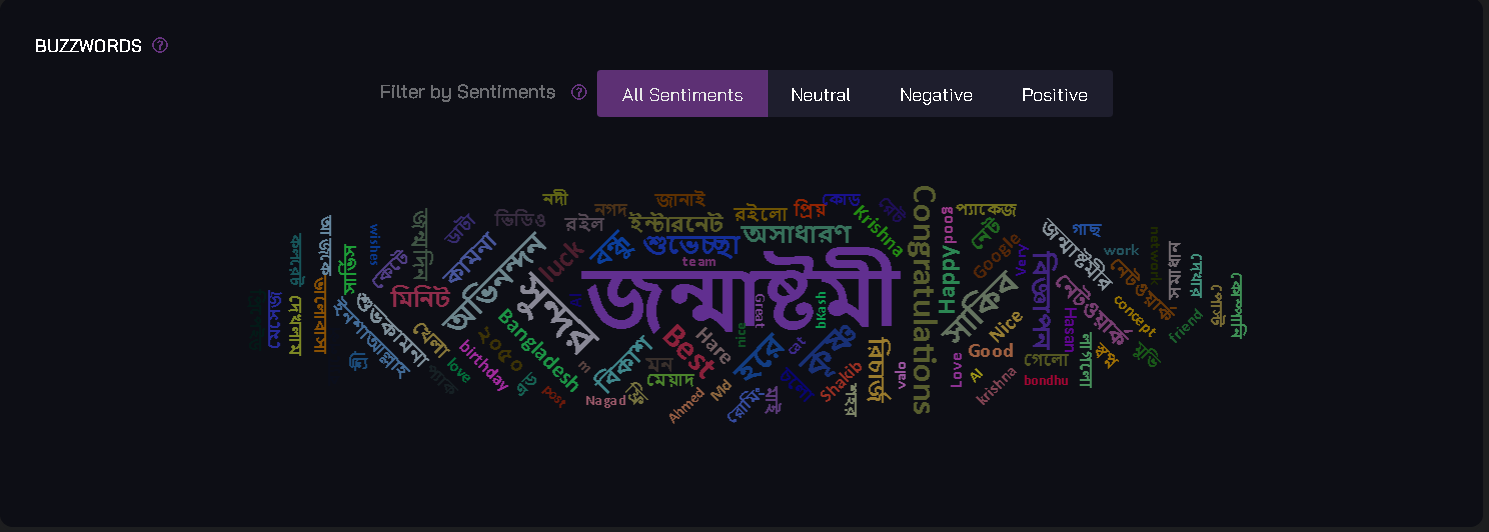
20. BUZZWORDS
- Description: Identify trending buzzwords and phrases associated with the source.
- Example Chart:
Ranked Posts
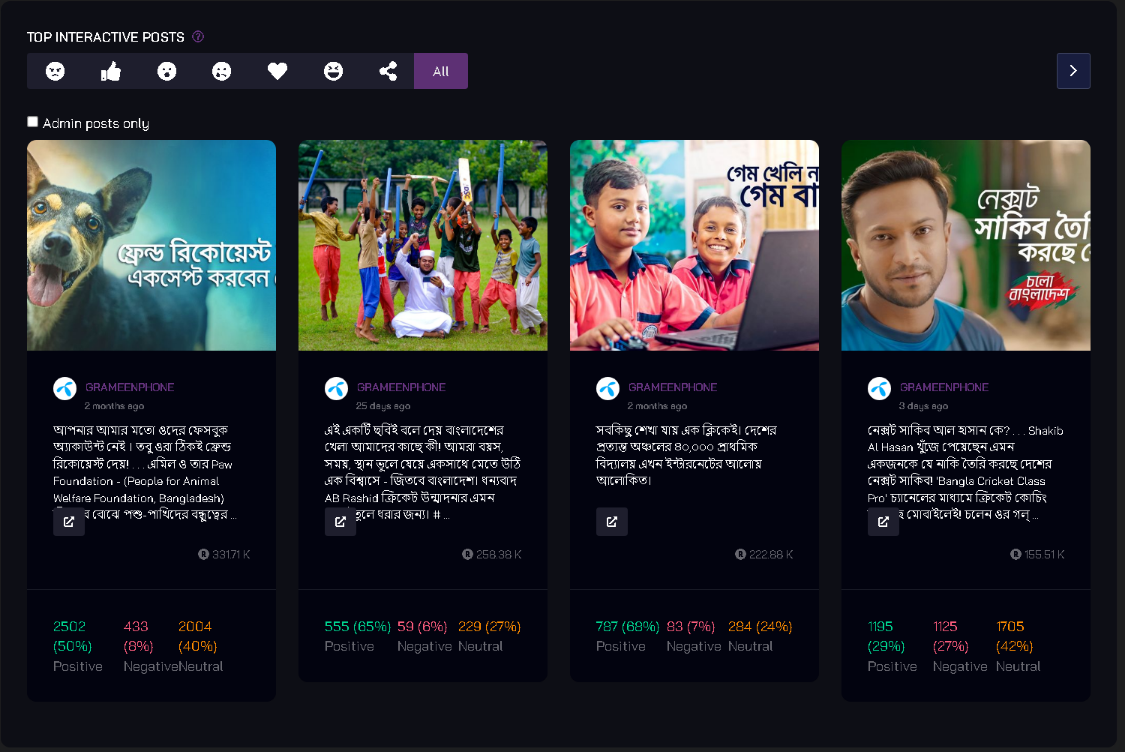
21. TOP INTERACTIVE POSTS
- Description: Discover the most interactive posts within the source, based on likes, comments, and shares.
- Example Chart:
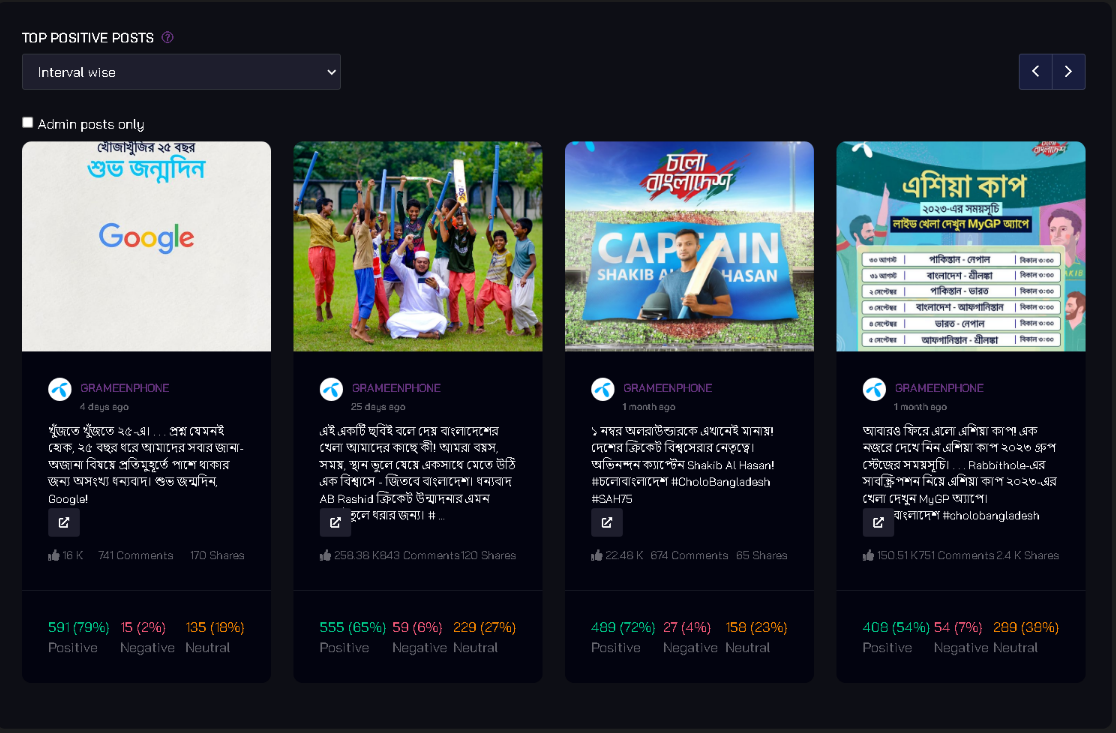
22. TOP POSITIVE POSTS
- Description: Identify the top posts with positive sentiment from the source's audience.
- Example Chart:
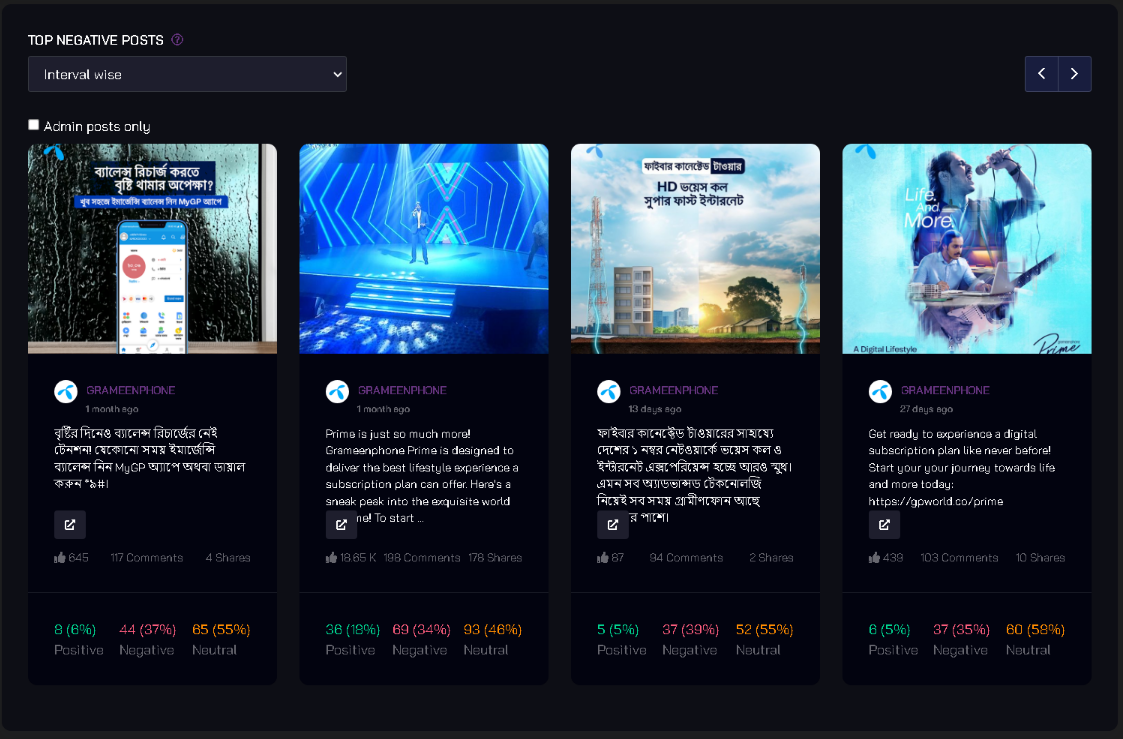
23. TOP NEGATIVE POSTS
- Description: Find the posts with the most negative sentiment expressed by the audience.
- Example Chart:
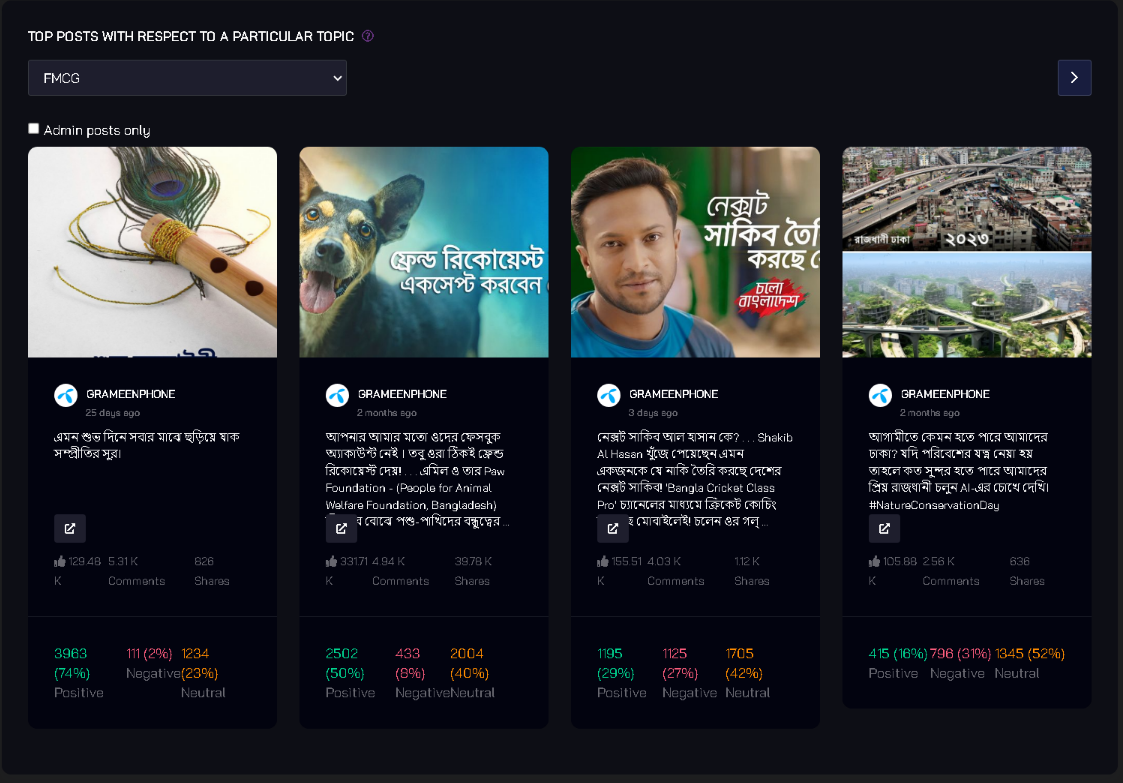
24. TOP POSTS WITH RESPECT TO A PARTICULAR TOPIC
- Description: Filter posts by a specific topic and identify the most engaging ones.
- Example Chart:
Audience Activity
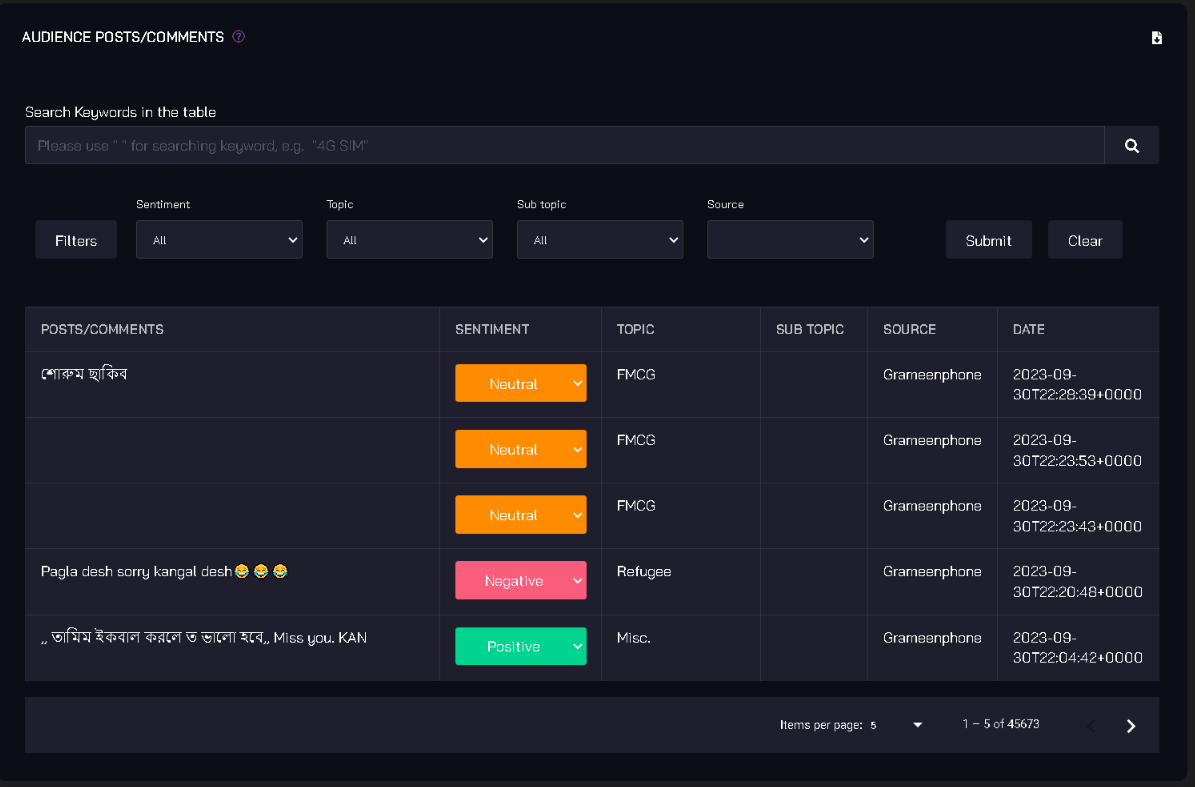
25. Comment List
- Description: View a list of comments and their details, including user information and sentiment.
- Example Chart:
Export Options
You have the option to export the full page as a PDF and send it via email for convenient sharing and storage.
Conclusion
The "Sources" section provides an in-depth look at individual sources or pages within your platform. By utilizing these functionalities and charts, you can gain valuable insights into user behavior, content performance, sentiment analysis, and more, ultimately helping you make data-driven decisions to improve your platform's engagement and success.